
How Principal Component Analysis can reduce complexity in demand forecast when you have too many predictors

 by Uzlifat Mir
- May 25, 2016
- 0
- Category: Business Intelligence
Organizations are facing challenges in managing their margins and keeping up with industry growth. Predictive analytics has helped organizations to be ahead of the competition and bring value to their customers. There are many organizations that have used predictive analytics across departments which have helped them increase market share, cut cost, and retain customers while maintaining healthy margins.
One of the most challenging fields in predictive analytics is demand forecast or demand planning. What is the demand for my product in the market and how much inventory do I need to keep in stock to avoid over/under stocking, these are two critical questions organizations must answer today.
The key factor while forecasting demand is to list down variables that are going to impact the forecast. There has been a great demand for macroeconomic forecasts using many predictors to be able to produce accurate forecasts. Whether ignoring or considering all these relevant variables would definitely influence forecasting accuracy and may result in suboptimal forecasts. Therefore statisticians have been developing effective ways to utilize the information available among these predictors to improve the performance of forecasts.
The principal component analysis is one of the methods that identify a smaller number of uncorrelated variables, called “principal components”, from a large set of data. The objective of principal components analysis is to simply obtain a relatively small number of factors that account for most of the variations in a large number of observed variables
Let’s look at an example –
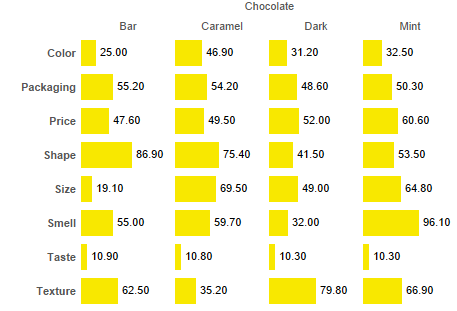
Say we want to analyze customer responses to several characteristics of four types of candies ( Dark, Caramel, Mint, Bar): shape, size, texture, color, packaging, smell, taste, and price. This step is known as product classification (refer picture a)
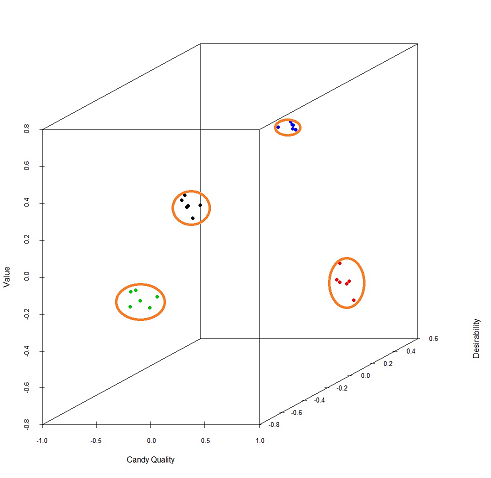
We need to determine a smaller number of uncorrelated variables which will help in reducing the complexity while forecasting demand. Principal components analysis will allow us to do that. The results yield the following patterns (refer to picture b):
- Taste, smell, and texture form a “Candy quality” component.
- Packaging and shape form a “Desirability” component.
- Size and price form a “Value” component.
This way we can reduce the number of variables and can use these three variables as input for demand forecast analysis that will determine how many candies we will be selling for a particular month/quarter based on historical data. Wants to know more in detail? contact us today!