
How to use Power BI in Education Industry – A Case Study
 by Uzlifat Mir
- Jun 23, 2016
- 0
- Category: Power BI Education, Power Bi Pivot
Power BI in Education Industry
Being into a BI Industry and offering various solutions to our Client for a long time, we had come across many tools and trends in Business Intelligence which helps Client in making correct business decisions based on our solutions. One of the trends which are booming currently is the Self Service BI’s, where the Client itself gets the flexibility to view their reports from their perspective and can churn their data to get it more user-friendly and dynamically. We came across one of our existing esteemed Client who wanted to implement BI solutions based on their existing ERP system for getting more business insight and better control over the business decisions. Looking at the trend and flexibility, they opted for a Self-service BI from Microsoft which is called as Microsoft Power BI.
Power BI as best BI tool
Power BI has evolved over the time and has proved to be one of the best BI tool available in the market today. Over the complete implementation phase, we were able to provide one of the best types of flexibility and visualization to our client. Since it’s a Microsoft Product, so it goes well with all its supporting Microsoft products and one of the greatest advantage for the Education, Government and NGO’s Industries is, Microsoft provides Power BI at a special price which usually goes easy on Client’s pocket.
Let us share some of our experiences with you all so that it will portray, how effectively we can use Power BI in Education Industry and bring changes to your businesses as well.
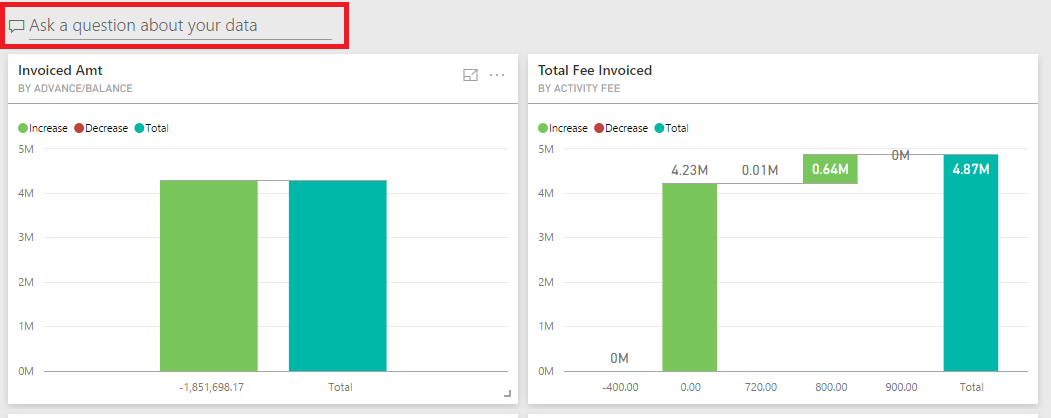
So to begin with, we delivered “Ask a Question” functionality through one of the existing features of Power BI. Under this functionality, Client has the flexibility to ask questions directly to his visuals and as per the question, the visuals would display the result. This is something which makes PowerBI stand out of the other BI tools available in the market. For e.g. Client wanted to know about the invoice details for a student whose name is “Aziz”. So he can simply ask a question in the dashboard stating “What is the Invoice for Aziz”. And the result would come up with all the Invoice details of Aziz present in the system, it’s that simple.
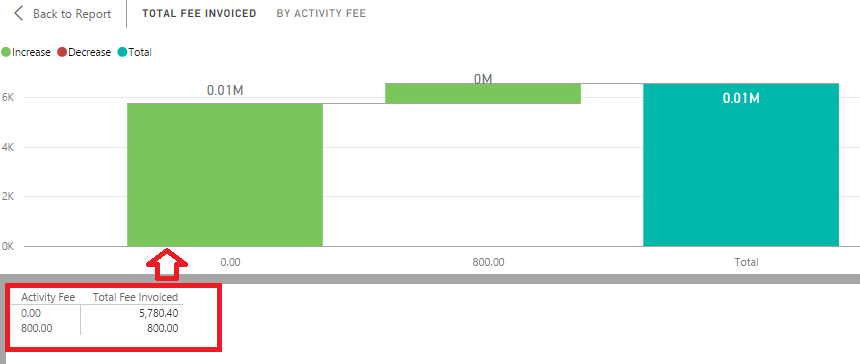
The next feature provided was the “Drill Down” functionality which helped our Clients in getting the drill down values of the Visuals which were displayed on the report. For e.g. if Visual A which will show fees paid by each student during the year, so it’s Drill Down will represent all the frequencies or the fees type which was paid, by student wise over the year. So basically it’s about getting more details about your visuals with just a click of a button.
Another feature provided was the “Interaction” feature which helped in interconnecting multiple visuals together. For e.g. Client wanted to know a student detail from multiple visuals like Invoices, Transportation Consumed, and Medical history. So under this scenario with the help of Interaction feature Client has to select Student in any one of the Visuals and the remaining two would automatically bring up the corresponding value of the same. The same way we had also provided a feature called as Slicer and Filters which gave our Client flexibility to slice and filter out the data and clearly visualize it for better understanding.
Looking at the business perspective of our Client, we were mostly focussed on the Accounting part of the business and we started with Fee summary report where the fees collected from the student were projected. It was further classified into Fees Invoiced, Fees paid and the Outstanding Fees for the Student. Also as per the requirement discounts provided to the students were separately tracked on each fee type and when the invoice was generated it made sure that all the appropriate discounts are applied to the fee type. Partial payment scenarios where the student has paid their fees partially and still has some more payment outstanding were also considered. All the three sub reports worked in a combination so that for a single student we can easily visualize how much he had been invoiced, how much he had paid and how much is the outstanding fees left from his side.
The other report is talking about the Fees which paid in Advances or the balance which was left for the Student. This report helped our Client in deciding and keeping a track on the Advances and Balance amount recorded in their system and based on that they can make further business decisions.
The same way we have deliver reports where the Clients can track their various Accounts, Journal Vouchers, New student registration, online payments etc. separately and last but not the least as most of our Clients request commonly we have implemented Money Inflow and Outflow report, which helps in projecting all the sources and the destinations from where the flow of the money is receiving and releasing, so the complete inflow and outflow of money in the organization can be easily visualized.
After the successful implementation of Microsoft Power BI in Education Industry for one of our Client, today we are confident in bringing a positive change in your business which will add value through one of the leading BI tools in market i.e. Microsoft Power BI. If you are looking forward to similar type of Implementation or interested in any of the features, you can simply mail us on sales@bistasolutions.com