
Top Features of Power BI
 by Uzlifat Mir
- Jun 13, 2016
- 0
- Category: Power BI Service
As a complete Self-service BI Tool, Power BI stands out with it’s unique array of features that facilitate developing truly interactive BI Dashboards. One can build interactive dashboards using varied data sources in minutes. The dashboards are accessible in app-based Power BI service platform, where the user can view, drill-down & apply report filters & even download them. Power BI Suite comes with some unique features in the BI Analytics space
Power BI suite
Power BI suite encapsulates features of PowerPivot, Power Query and Power Maps to provide a comprehensive solution for BI Reporting & Analytics Reporting. One can easily build a pivot table summarizing the data. With Power Query, one can combine, and refine data across a wide variety of sources including traditional data sources, relational, structured and semi-structured, Web, Hadoop, Azure Marketplace, & others. Power Query also allows one to search for public data from sources such as Wikipedia. With Power Map, one can easily visualize data split by geographies. Also, Power BI can be quickly integrated with Microsoft Excel through Excel-Add Ins. So one can also publish a Dashboard Report made in Excel in just 1 click.
Importing data from multiple sources
Data can be imported from sources ranging from conventional relational databases to varied data source platforms. Data can be imported from Facebook, Sharepoint Online list, SalesForce, Google Analytics, Microsoft Azure data warehouse, Hadoop Distributed File System (HDFS) and much more
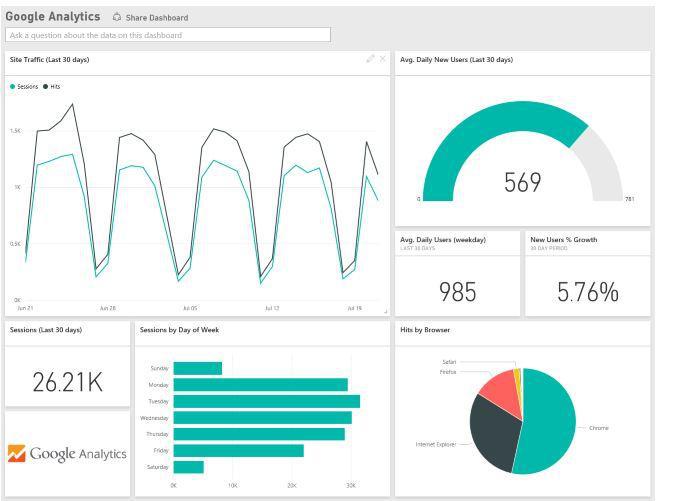
One can instantly create the website usage Dashboard by connecting the google analytics provided in Online Services of Power BI
Visualizations
Combo charts, treemaps, fill maps, gauges and funnel charts provide customers with more ways to view their data in Power BI.
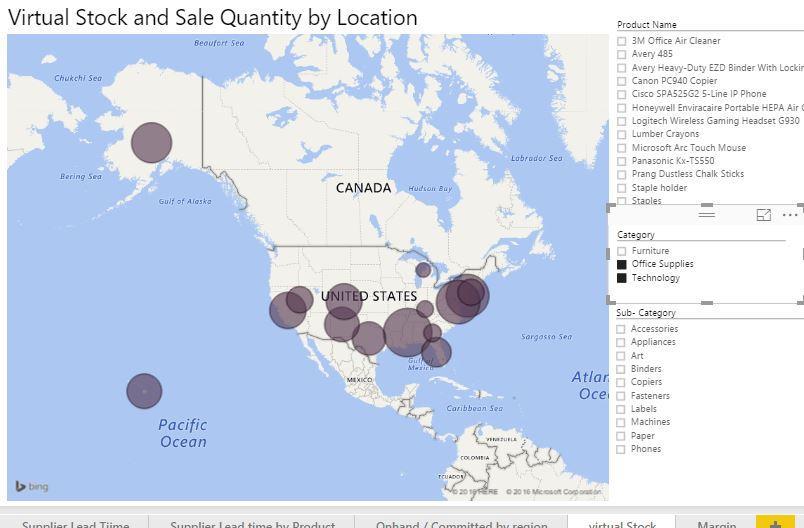
Power View enables for ad hoc, self-service data visualization, and Power Maps. It enables users to view data containing almost all geographical attributes in a 3D-rendered Bing Maps environment.
Natural-language search technology
Natural-language search technology, helps users ask questions of their data by typing into a dialog box. The system then understands and provides answers in the form of interactive tables, charts, and graphs. It also allows one to ask questions about the data & get answers in visuals.
With Natural-language search, one can just for the search for something & get macro-level insights represented by interactive dashboards quickly in minutes. So to get counts split in various geographies one can search something like Olympic medals by Country, Unemployment Rate(US), Housing Prices by cities & many more questions.
Power BI Advantages & Features
To summarize, below are some the unique features of Power BI
-
Reports are deployable on multiple platforms like web, mobile apps, tabs. It allows you to choose device of your choice without worrying about the database platform
-
NLP is a unique feature which helps to create reports with data from online services like Bing Maps, Google Analytics
-
Power BI is capable of independently handling almost all the Data extracting & Data summarizing functions which ANSI-SQL scripting & Excel provides. So no need for SQL scripts for extracting & summarizing data
-
Visualizations facilitate drill-down & drill-up & get data & even export data as per the hierarchy.
-
Easy integration with Excel Data source including charts, pivot tables, pivot charts. Excel Dashboard can be pinned & published to Power BI service
-
Text Searches gives all possible answers about the data in Power BI service. Power BI identifies objects by the keywords typed in provides the output in form of visualization
-
Calculated columns & measures can be incorporated in the loaded Dataset independent of the Data source. Also, Queries parameterized Queries & filters can be applied on the Dataset level without any effect on the Data Source.
-
Separate Relationships interface with auto-detect relationships IntelliSense.
-
DAX functions supported. Also, the UI has a great intelligence of identifying the tables & field names as you type in.
-
Facilitates incorporating Interactive visuals. Also one can import visuals from Visuals gallery, which is a free online collection of visuals & can quickly incorporate it in the report.
-
Lastly, pricing is per user/month is like pay-as-you-go, which is very aggressive. For more details on the pricing please click Power BI pricing.
-
Power BI users also have access to online community where they can ask questions & raise tickets & the official website has blog & great resources for self-learning
Contact us at feedback@bistasolutions.com. For a free evaluation of how big data can be leveraged to provide you a competitive advantage.