What are the 9 ERP Implementation Phases?
Implementation of an ERP system for a business is not a simple task. It is a project that typically takes at least a few months and can take several months or longer if the project is larger. The reason for this is that ERP systems must be implemented, configured, and customized for each business. Since having the correct system is so important, it’s crucial that the proper amount of time is allocated to deliver the final product.
Though the ERP implementation timeline is relatively long compared to “out-of-the-box” solutions, the process can be separated out into multiple stages. In addition, it can be made more manageable through an agile approach. With an agile approach, different parts of the software may have different phases running at the same time. Some phases may also be repeated if user testing discovers new issues or a need for additional customization. With that in mind, here are the 9 phases of ERP implementation:
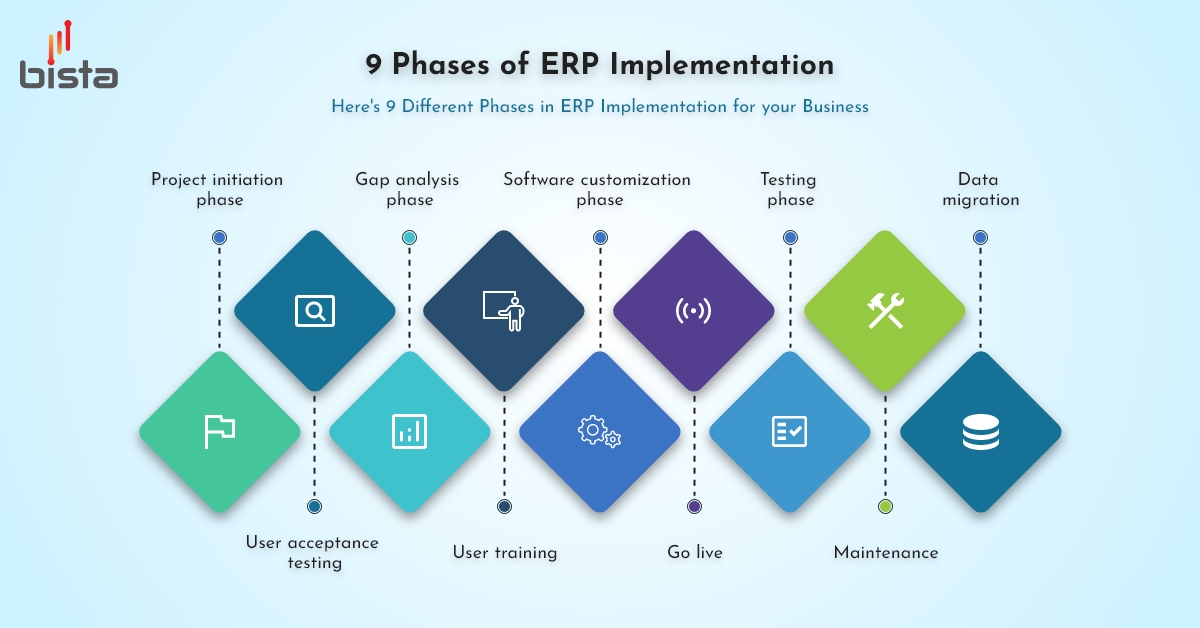
- Project initiation phase:
The first ERP implementation phase is the project initiation phase. Here, the client contacts the vendor and gives them an idea of what they are looking for. What industry are they in? Are they looking for a heavily customized project or for one following best practices? What modules are they looking for and what do they seek to benefit from it? After getting a basic understanding of the requirements, the implementation partner selects the SME (subject-matter expert) with the best techno-functional knowledge for the job.
- Gap analysis phase:
This consultant then will go to the client’s business and conduct a gap analysis, an analysis to determine the current state of the business & its processes vs. what its optimal situation would be with the proper ERP software in place. This will be a very detailed report outlining the structure of the company, how many employees they have, what their departments are, who will be users of the system, who sees what information, and so on. Customization points will also be identified. The end result of this will be a Business Requirements Document (BRD).
- Software customization phase:
With the BRD prepared, the subject-matter expert will form a team of developers to work on the project. Now the software customization phase begins. The development team will configure the product for the company based on preset options within the software. They also will customize it, adding new features to the application. Finally, they’ll integrate it with other software. This last step depends on what software the business is currently using and wants to retain, or what it anticipates it will need in the future. (For example, some eCommerce sellers integrate their eCommerce platform with their ERP).
- Testing phase:
After customizing the software, the implementation partner will test it to see if the code works properly before moving forward. This will typically involve unit testing and another internal testing.
- Data migration:
In the next ERP implementation phase, the client will begin the process of data migration, taking their data from existing systems and putting it on their new software. Access rights, passwords, etc. will start to be put in place here. Integrity checks will also be done to make sure that the data has been successfully transferred and that there are no errors.
- User acceptance testing:
Now, user acceptance testing (UAT) begins. UAT is the closest thing to real-world tests before the software is fully deployed. Here, specific users in the company will run tests with the new software in parallel with their old software, making sure that they achieve matching results. Once this is done, it will signify that the ERP system or at least certain parts of it are ready for deployment.
- User training:
After the software is ready, user training will begin. In this phase, the full set of employees that will be using the new ERP system gets trained with it. This will involve the use of manuals/training videos as well as additional training from the vendor. Training will be done according to specific functions, e.g. for sales, marketing, accounting, etc. This can occur on-site or offline, depending on the request.
- Go live:
Finally, when all is said and done, the project goes live. The new software continues to run in parallel with the old software in the near future. This gives the business owner peace of mind and helps confirm that there are no issues.
- Maintenance:
The relationship doesn’t end there. Depending on the contract, the vendor will continue ongoing maintenance and support to make sure the product keeps working well, giving the business owner further peace of mind. On top of that, if any additional features are requested, the vendor with expertise in the system can make those changes.
Those are the 9 ERP implementation phases, from project initiation to deployment and maintenance. As said before, in an agile approach some of these phases may run at the same time or be re-run when errors are found. Having an agile approach combined with a phased methodology ensures strong organization, resulting in an outstanding ERP system.
If you’re interested in implementing ERP software or have any questions, get in touch. Bista Solutions has over a decade of experience implementing business solutions and ERP software for hundreds of customers.

by Uzlifat Mir


 Get a Tailored