Odoo Openerp: U.A.E. Localization

  • by bista-admin
  • Apr 03, 2017
  • 0
  • Category:

Odoo OpenERP: U.A.E. Localization

Odoo is the fastest-growing ERP software in the world right now. With more than 2 million users functioning on it and with new extensions that integrate other business functions such as CRM, CMS, and E-Commerce, it has incontrovertibly become the most coveted free software by businesses worldwide.

What is more compelling is the fact that it is extensively customizable to the whims directed by the programmer, operated by the most advanced intelligence and logical foundation that currently exists. This paves the way for further manipulation of the design and interface to the user’s very specific needs. Coming with a professional support and warranty like other countries just to adds its viability.

There are almost more than 200 localization apps for different countries such as Russia, Ukraine, India, Indonesia, Algeria etc.

Odoo/OpenERP U.A.E. Localization was planned to give all U.A.E. guidelines and practices in odoo/opener to make it more versatile in advertisements.To accomplish this we have executed different modules

Giving standard U.A.E bookkeeping rehearses like one accomplice one record, adjust by an accomplice and so forth.

Aside from this, we have additionally actualized standard practices of HR alongside Self Service Portal, WBS File Generation, Gratuity, ISPF, and ESIC announcing.

This localization contains standard accounting practices Thar being followed by U.A.E. accountants and accepted by U.A.E accountants.

Odoo OpenERP localization means to create odoo openerp database with custom localizations i.e. with country currency and country specific chart of accounts and legal reports (trial balance, balance sheet and income statement, profit and loss statement).

Features of this localization

1.Separate account creation per partner

2.Accounting entries as per norms and legal practices

3.Separate account for suppliers and customers

4.Bank account reconciliation

5.Customer payment due reporting

The accounting profession in U.A.E has been growing remarkably with its growth.During the early days of the formation of the country, most of the accounting profession was held by Asians.With the expansion of U.A.E and so remarkable growth in its accounting.

ERP Accounting:

The manual accounting of the good ‘old days has been overlooked after the landing of ERP. With more business open doors and bookkeepers from everywhere throughout the world, we can see utilization of assortment of ERP in the district. Global programming from SAP, Oracle, Sage, QuickBooks, Peachtree to local particular programming resembles Tally, Focus, and so forth to privately engaged programming resembles Comrade.

Budgeting & Analysis:

The underlying motivation behind having the bookkeeper from an agent was simply to comprehend the productivity of the business and to comprehend the money related position. Yet, today the part has expanded to planning, dissecting, costing, and so forth.

MIS Reporting:

There is parcel of MNC’s working in UAE and they have impacted the way of life of MIS Reporting in the area. Consequently, month to month shutting off the books of records has likewise picked up the parcel of noticeable quality.

Leadership:

Money is the Lifeblood of any business and since bookkeeper is the person who works the trade out the business his part has been expanding. The part of a bookkeeper is developing in the transaction with money related establishments, providers, clients and other key partners. The UAE has an effective SME area and more often than not bookkeeper is the fund administrators of the organization.

we hope this short snippet would have helped you in getting some insights of Odoo Openerp UAE Localization. Stay tuned for more information on odoo.

Please feel free to reach us at sales@bistasolutions.com for any queries on odoo and its related modules. Also, you can write us through feedback@bistasolutions.com and tell us how this information has helped you.

Odoo V10 Amazon Connector Module

  • by bista-admin
  • Mar 31, 2017
  • 0
  • Category:

Introduction:

It can integrate, amazon-sellers manage and connect all your amazon seller account operations from odoo and can save your time by instantly entering items and inventory data to amazon.It is being very much essential to amazon seller account with odoo, if you are a seller on Amazon Marketplace and using odoo for all other business operations.

Odoo Amazon Connector module automates your vital business processes and eliminates the need for manual data-entry in odoo by enabling bi-directional data exchange between Amazon Marketplace and Odoo.

Amazon Seller Account Management is so easy in Odoo:

Firstly the user must be given all the access rights so that it is easy to go through the whole integration process of amazon.

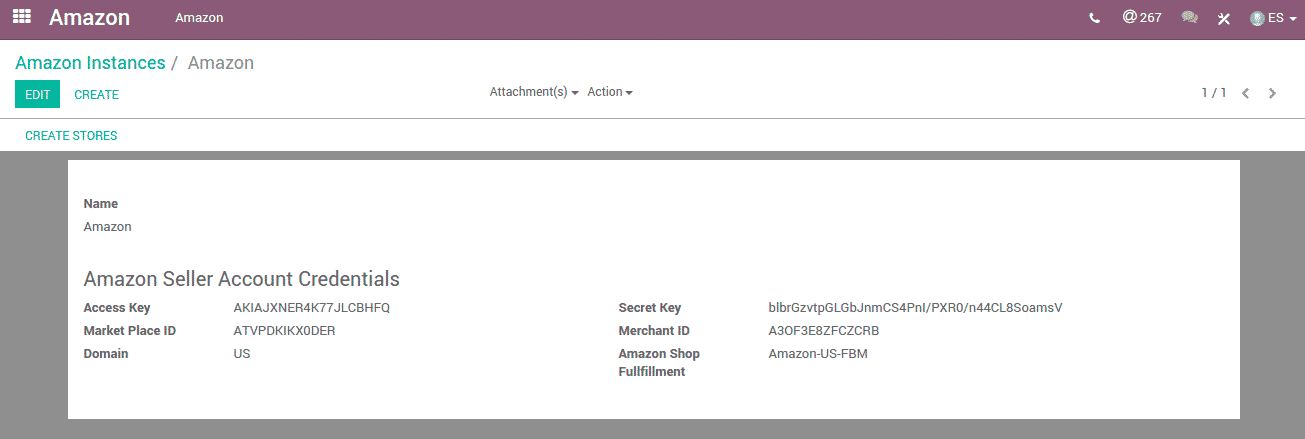
After the complete installation of the module, an instance is to be created in amazon in which the credentials are needed such as access key, marketplace id, secret key and merchant id etc.

We can see from the image described below:

amazon1

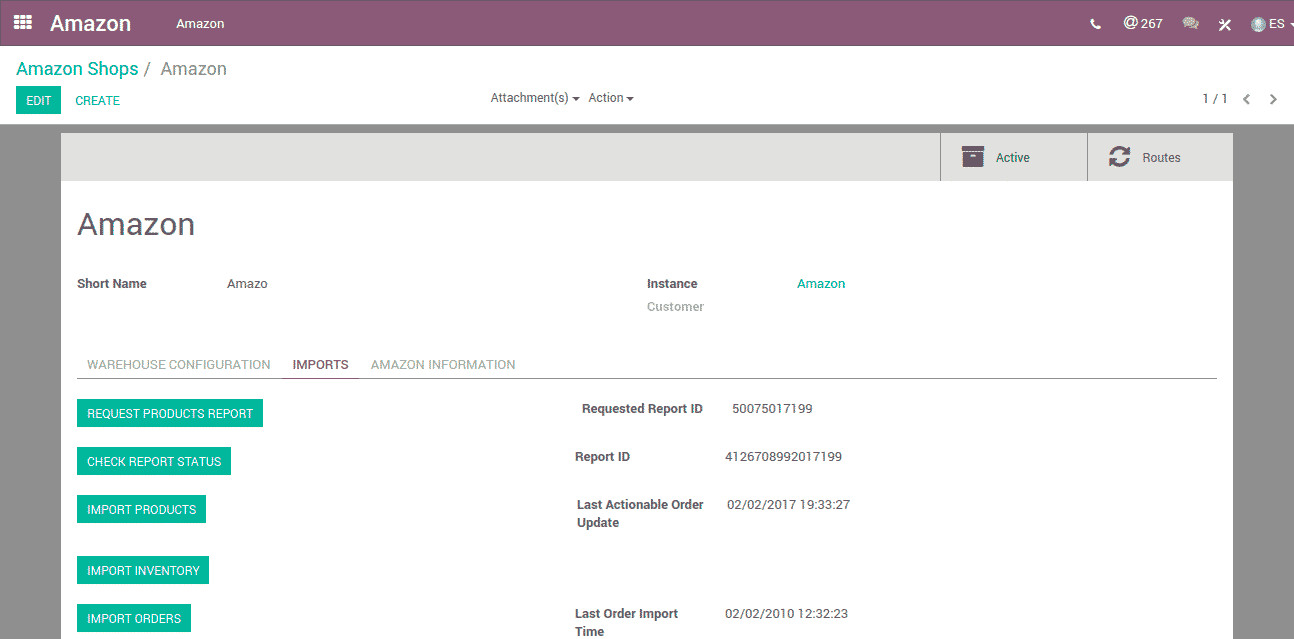
Then by clicking on amazon and then on shops, e could see that a shop has been created as follows:

amazon2

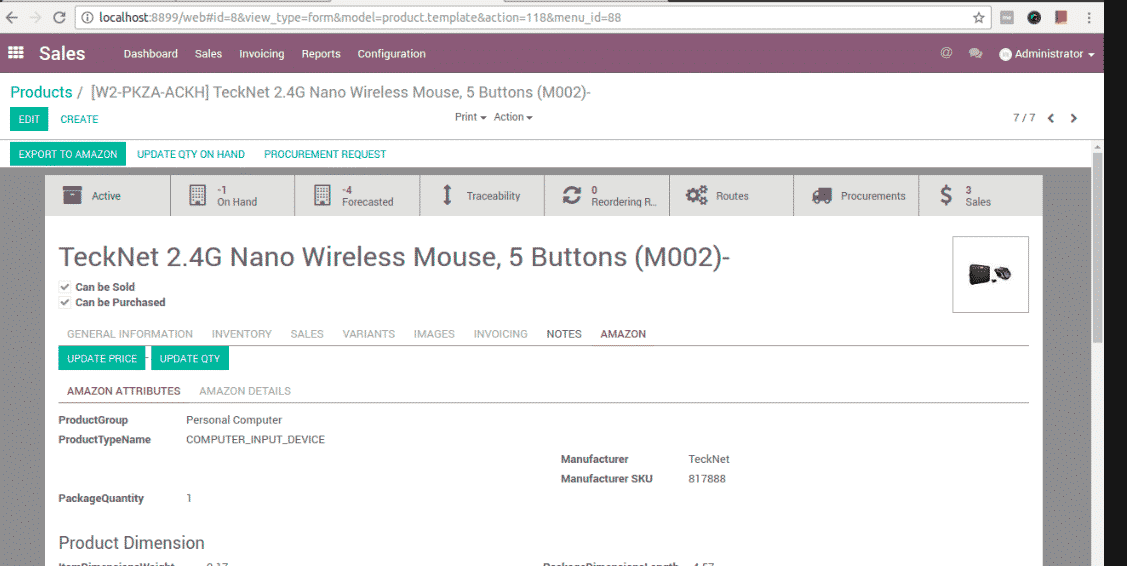
By clicking on this the whole detailed description could be seen and various important parameters are there-

amazon3

Request Products Report means that whenever we click on this the report status of the product will be checked and secondly an unique id is generated for every product as mentioned and you could also see in the above image.

Import products means the same products which are present on the website of amazon could be integrated with odoo as well and their price and quantity could be updated as well which directly could be seen on the amazon website.

Import inventory is linked with the inventory adjustments in inventory module and import orders with the sale orders in sales module and we could see those orders from amazon website.

amazon4

Fulfillment by Merchant/Merchant Fulfilled Network

Merchant fulfilled network simply refers to sellers shipping their own products directly from homes, businesses or warehouse after receiving their orders through Amazon.This means that locating the stock, packing the orders, arranging for the shipping and providing all customer service is the direct responsibility of the seller.

One clear advantage of using merchant fulfilled network is that amazon sellers can ensure that the packaging is completely safe.Sellers can also create custom packaging to differentiate their Amazon store from competitors.

Merchant Fulfilled Network sellers have the advantage of packaging and shipping their products exactly the way they want. But, that means they also have to pick, pack, ship, and handle customer service.

This was all about Odoo-Amazon Connector Module of Odoo version 10.

Please feel free to reach us at sales@bistasolutions.com for any queries on odoo and its related modules. Also, you can write us through feedback@bistasolutions.com and tell us how this information has helped you.


MACHINE LEARNING

machine learning

Introduction:

Machine Learning is the advanced method of data analysis which iteratively learns from the data. Today, Machine Learning is not limited to the books or the theoretical knowledge only, it has crossed its limit and benefitting the entire world. As a new breed of software that can learn without being explicitly programmed, machine learning (and deep learning) can access, analyze, and find patterns in Big Data  in a way that is beyond human capabilities.

Evolution of Machine Learning:

Machine Learning is not new and it was discovered in 1950’s with simple and basic algorithms, but why it has gained so much of popularity in recent years? Because of new computing technologies, machine learning today is not like machine learning of the past. It was born from the pattern recognition but now it can adapt the new data behavior from the previous computations. It has gained the ability to learn the problem-solving approach without being explicitly programmed for every single task.

The machine learning has changed the mindsets. Now, the things are possible which we cannot even think earlier.

Here are a few widely-publicized examples of machine learning applications you may be familiar with:

  • A self-driving Google car. The essence of machine learning.

  • Amazon and Netflix recommendations for daily life.

  • Fraud detection.

Why is Machine Learning Important?

Let’s look at the facts, why machine learning is so important? There are several reasons:

  • The four V’s (Volume, Variety, Velocity & Veracity) of Big Data which really needs to handle more accurate and in an efficient manner.

  • Machine Learning made it possible to quickly and automatically produce models that can analyze bigger, more complex data and deliver faster, more accurate results – even on a very large scale and avoid unknown risks.

Who’s using it?

Most of the industries are using “Machine Learning” technology, especially those who are working with a large amount of dataset on daily basis. They understand the value of machine learning technology.

The sectors, who are using machine learning on a large scale have been discussed below:

Financial services

The financial industries like banks or other businesses using machine learning technology to fulfill their two important objectives: to identify the important insights of the data and prevent fraudulent activities. The insights can help to introduce new services and to understand their customers to serve them in a better way.

Marketing and sales

The machine learning helps to recommend and promote items you’d be interested in. It’s completely based on your past product interest and your purchase history. It captures the data, analyze it and uses it to personalize the shopping experience. The companies also using these analyses for many other things like running campaigns or offers etc.

Machine Learning Methods:

Two of the most commonly used machine learning methods are Supervised Learning and Unsupervised Learning – but there are also other methods of machine learning.

Supervised learning 

The majority of practical machine learning uses a supervised learning. All data is labeled and the algorithms learn to predict the output from the input data.

Supervised learning problems can be further categorized into two categories:

  • Classification: A classification problem is when the output variable is a category, such as “A” or “B” or “Yes” and “No”.

  • Regression: A regression problem is when the output variable is a real value, such as “rupees” or “weight”.

Explanation:

Algorithms are trained using labeled examples, such as an input where the desired output is known. For example, a part or a product could have data points labeled either “S” (stock) or “O” (out). The learning algorithm receives a set of inputs along with the corresponding defined outputs, and the algorithm learns by comparing its actual output with defined outputs to find the differences. It then modifies the model accordingly. Supervised learning is commonly used in applications where historical data points are likely to predict future. For example, it can anticipate when the order attempt is likely to be random or a genuine.

Unsupervised learning 

Unsupervised learning is where you only have input data (X) and no corresponding output variables.

These are called unsupervised learning because unlike supervised learning above there is no correct answers or defined labels. Algorithms are left to their own devices to discover and present the interesting structure in the data.

Unsupervised learning problems can be further categorized into two categories:

  • Clustering: A clustering problem is where you want to discover the inherent groupings in the data, such as grouping customer types by their purchasing behavior.

  • Association:  An association rule learning problem is where you want to discover rules that describe large portions of your data, such as people that buy eggs also tend to buy bread.

Semi-Supervised learning 

Problems where you have a large amount of input data (X) and in that only some of the data is labeled (Y) are called semi-supervised learning problems. The semi-supervised learning method is closely related to Supervised and Unsupervised methods.

Most of the real-world problems deal with the semi-supervised learning method because in the real world most of the data inputs are partially labeled. It’s easy to get and store the unsupervised data.

The scope of Machine Learning:

Machine Learning is a large future promising scope. It mainly focuses on neural network data processing algorithms. In the near future, we will be able to deny that a computer does not have IQ.

What Yet to Come?

There are several things which are yet to come, among of all some of them are listed below:

  • Real -Time speech translation.

  • Prolonging the mobile devices battery life – will prevent the unnecessary consumptions of the battery from apps.

  • Neural-Network running on our mobile devices.

  • Health and Fitness -will detect and help to cure diseases.

  • Cyber security optimization.

Worldwide dedicated teams are working on a large scale to make “Machine Learning” more accurate and reliable for taking complex business decisions.Do let us know your feedback on feedback@bistasolutions.com or you can reach out to us at sales@bistasolutions.com

Business Intelligence And Analytics In The Cloud

The Story So Far

The invention of supercomputers brought down computation speeds considerably. The evolution of such computers in the 50’s and 60’s brought down the costs of acquiring and using one for day to day purposes. More and more organizations wanted these machines for complex computations which led to the birth of Enterprise resource planning (ERP) systems.

  • Material resource planning (MRP) systems were the first set of proper automated planning systems to be used by manufacturers for production planning.

  • In the 70’s and 80’s planning and data management spread to other functions such as human resources, finance, accounting.

  • The 90’s then brought about the commercial use of Business Intelligence (BI) and Analytics.

It was the need of the hour for companies to use the data they were gathering for insight into various aspects of the business and derive decisive actions to increase their competitive advantage. Not to mention, reduce costs across the organization.

Thus, organizations started storing each and every type of data that they could think with the pretext of using it for some form of analysis in the future. Storing every bit of information required lots of infrastructure and associated costs.

  • The larger companies had the capacity to invest in servers for storing and processing data.

  • The smaller and medium enterprises (SME’s) could not, however.

1

In the advent of the Dot-com bubble, Data center’s sprung up all over the world due to high-speed internet connectivity. This allowed the SME’s to collaborate with companies who had setup up data center’s and allow their data to be stored at these data center’s and use the data center infrastructure for data processing. This setup henceforth was commonly referred to as cloud computing.

Business Intelligence as a concept has been existing for a few centuries. With the breakthrough of supercomputers came the technological side of BI which meant completing a task faster than what it would take if it was to be completed by a human. Because the technology was expensive and required a lot of space it was not common for organizations to invest in technology for the purposes of using BI. Only when personal computers were invented and then tools like Lotus notes and Microsoft Excel were accessible, organizations of all sizes ventured into using technology for BI purposes. These tools also gave users a chance to represent data in a graphical format thus allowing a better way of analyzing data and their business.

The Last Decade

The rise of spreadsheet-based tools provided end users the perfect platform for ad-hoc analysis and represent that graphically in the most intrusive form. The dominance of these tools was categorised to its ease-of-use, features, quick report and graph building turn-around-time, ease of sharing between users, the wide variety of formatting options.

  • All major ERP systems had to get themselves compatible with these tools.

  • They had to ensure data could not only be an uploaded from the spreadsheet into the ERP but could be extracted from the same ERP in a spreadsheet format.

Thus, spreadsheets became the most common tool of use because the users could extract data, perform the analysis, draw results whether in a tabular form or graphical and present it using only one platform throughout the analysis procedure.

This was all very good for organizations of all sizes. But spreadsheets still had one and only one major drawback. The technological incapacity to process data beyond a certain point. Moreover, organizations irrespective of their size started to realize the power of BI and the positive effect it had on business. Thus, started the evolution of BI tools.

  • Tools which had one and one only objective; provide means for importing, analyzing and/or presenting information using large volumes of data or Big data which could not be done by any available spreadsheets.

  • Most tools that existed in the market worked in silos.

  • Some could only perform ETL operations or provide means of aggregating data or provide a superior formatting and presentation platform.

But there weren’t any known tools which could do everything together and everything efficiently. They probably were prominent and one dimensional and were trying to evolve into a one-stop shop for BI and analytics.

Albeit, a lot of them evolved in the same direction as the requirements of the BI end users i.e. their core was BI and analytics and rest of the features were built upon this core. Tableau, Jaspersoft, Qlikview, SpagoBI were some of them that evolved into excellent tools each one creating its own space in the market. The only thing common between them was a desktop based application where the user would create content and a web-based platform for sharing that content. Thus, all of them were trying to provide the similar output which includes a long list of BI requirements. These include data collaboration, data discovery, master data management, data quality, data integration, data visualisation, data analytics, data science, data storytelling, predictive analytics, cloud BI, Hadoop and Big data, self-service BI.

The next few years…

With BI being a focus for almost all companies the market is now flooded with all kinds of tools. Each competing for some space or the other. However, this cluttered segment shall not remain for too long. Just like how SAP and Oracle created their own niche in their ERP segment, two or three of the mentioned players shall do the same in the comes months or years. This will change once organizations start looking at BI tools with more than a generalistic way i.e. prefer BI tools based on certain set of features. For example, some of them have already started preferring tools which give an excellent could based platform. Thus, from the long list of BI requirements, the following might be a trend in BI and analytics space for the next few years. The top three include:

  1. Master data management

In BI space master data management is the equivalent of data consolidation from various silos into a combined set. A lot of organizations even today have data stored in different module across different erps. This makes BI and analytics extremely difficult since data is spread far and wide and the time consumed on ensuring data quality is not compromised during the consolidation process. In other words, we can say data quality and data management go hand in hand. Organizations always relied on ETL tools but now shall look for an integrated platform. What this feature does is allows flexibility for organizations that do not have data on one platform and therefore spend time on merging data. This will also evolve into tools allowing combination data from all platforms available i.e. if sales data, supplier information, manufacturing data, warehousing are all on different servers the BI tool shall provide the capability of coming this within its own environment as required by the end user. This is irrespective of a size of data existing in each of the data sources being imported into the BI tool. This will majorly reduce the time to insight which actually is the main objective of any BI tool.

  1. Self-service BI

Although most BI tools have the objective of end users creating content and using that for analyses, each BI tool has its own learning curve. Moreover, if the learning curve is steep most users tend to give up on a tool thereby adapting or adopting the one they were using earlier. The flipside of this is content creation on these tools is then handed over to the IT team of the organization as they would have a smoother learning curve. This would then lead to a lot of back and forth communication and dependency on the IT team. The efficiency of achieving the desired result would not be high as compared to a self-service BI. This means each user is capable of creating his/her own content without the support of their IT team. This will allow fast turnaround times for insight and is a huge factor for our next trend, Mobile BI.

2

  1. Mobile BI

The evolution of Laptops might have led to the ease of sharing business insights across geographies. But this had created device dependencies. While BI was growing across the world and establishing its requirement for every organization, the smartphone market was born. Before half of the world recognized the impact BI could have on businesses almost all the users creating BI content or at least consuming it had a smartphone. All the BI tools mentioned earlier took the smartphone evolution as another stepping stone and use this platform to evolve their own products. They tried to provide a similar platform if not exactly the same for developing BI content on a smartphone. The features being the same, only an extension to the existing desktop platform. It may not be easy to extrapolate the impact of using BI on a smartphone today. But with more and more businesses adopting smartphones and tablets as their choice of device for means of communication and day-to-day use Mobile BI shall be the next sought after requirement in BI and analytics.

For more insights on Business Intelligence and Analytics feel free to get in touch with us through sales@bistasolutions.com, you can also write your feedback on how this blog has helped you at feedback@bistasolutions.com.

Odoo versus SAP – Which is Best Choice and Why?

  • by bista-admin
  • Mar 10, 2017
  • 0
  • Category:

About Odoo:

Odoo (OpenERP) is an open-source comprehensive suite of business applications for sales, CRM, Project management, warehouse management, accounting, manufacturing, HR, and much more. With a strong and robust MVC(Model-View-Controller) architecture, flexible workflows, a dynamic GUI, and customizable reporting system integration Odoo offers over 3000+ modules specifically designed for business to improve their performances.

Then again, SAP is one of the most established ERP arrangements in the market. The correlation of Odoo to SAP is by all accounts a snappy recommendation for the present as the new goes up against the old.

With odoo offers an accumulation of remarkable elements, is bug-free, and has experienced experts, who give Odoo improvement benefits at a spending cost.

Meaning:

Discharged under the AGPL permit, Odoo is one of the best open-source business applications that is composed in Python, whereas SAP is a venture asset arranging programming that coordinates every one of the procedures of the bigger association.

Odoo being open source is allowed to be utilized and disseminated, and henceforth has brought down cost contrasted with whatever other paid ERP arrangement – for this situation SAP.

Odoo with no permitting expense is a feasible choice for small to medium-scale businesses. In any case, this doesn’t imply that is not reasonable for substantial companies or associations.

Unique and Fabulous Functionality

Usefulness is one of the key perspectives for both stages. Being open source, Odoo offers a great deal more opportunity and adaptability contrasted with SAP.

With its source code accessible, the association can contract skilled designers to deal with the customization and there is no shortage of them in the market.

Then again, SAP offers a decent choice, however, the absence of free code can truly upset the development of the organization. This doesn’t mean you can’t alter the SAP arrangement – however, that includes some significant downfalls higher than Odoo.

Bugs:

No product arrangement is 100% secure and that is the reason the genuine question is which stage illuminates the real bugs and keeps the arrangement usable for the association.

As far as bugs, both stages are practically equivalent. The arrival of Odoo V8.0 ingrained certainty and trust in the business and now numerous huge organizations are moving towards Odoo.

SAP then, in addition, offers bug settlement now and again.

Business Experienced Professionals

Odoo has developed into one of the major ERP arrangements in the market. The beginning was moderate, however now they are carrying on the serious canons, and with the arrival of Odoo V10.0, they are currently showcasing themselves as a total business suite for associations.

There is no shortage of designers and henceforth associations can concentrate on business and not on the business suite they are utilizing. Consultation is additionally promptly accessible for Odoo.

SAP is not a long way behind and offers great engineers and counsel. In any case, the cost of SAP advancement is way higher compared with Odoo.

Wrapping Thoughts

We discover Odoo a superior arrangement that is perfect for all organizations. If you are discovering its marvelous components are ideal and as per your needs, then Odoo is the great decision for you. SAP, then again is exorbitant and offers less adaptability contrasted with Odoo.

This was all about Odoo Vs Sap: Which Is the Best Choice And Why? We hope this short snippet has helped you get some information regarding Odoo

Please feel free to reach us at sales@bistasolutions.com for any queries on Odoo and its related modules.

ERP And Its Impact In The Indian Market

ERP Solution

What is ERP?

Enterprise Resource Planning or ERP is business process management software that allows an organization to use a system of integrated applications to manage the business and automate many back office functions related to technology, services, and human resources.

ERPs help associations to decrease general cost, at the same time expanding efficiency, enhancing reaction time, bringing down stock levels and improving for client introduction. It likewise helps in enhancing their administration and operational control.

How did the Indian Market come in flow with ERP arrangements?

Despite the fact that ERPs have much to convey to the table, the India market was very hesitant in ERP usage. How ERPs came to be utilized by Indian associations is fascinating, without a doubt. ERP programming arrangement at first was basically utilized for back office arrangements and was dealt with like simply one more bolster capacity.

In any case, after the crumple of the product showcase and different possibilities, organizations needed to turn towards ERP arrangements and find out about them as they were in a defenseless situation. This, at last, made every one of these organizations and associations mindful of the advantages that one can harvest from a legitimately executed ERP and began consolidating it into their whole business framework.

Again we can think about that India is presently changing the world IT center. Subsequently, all significant players in the field are continually endeavoring to advance and grow their market base. Aside from a commitment to these huge organizations, ERPs will, for the most part, be useful for the littler and medium-sized businesses to develop and thrive.

ERP and Current Scenario in India

In any case, some ERP designers were focusing on the emergency of this market and are presently prepared to give moderate ERP answers for these littler organizations. As of now, the SME’s fragment in India has turned into the most confident connectors for ERP arrangements. About 60% of the SME’s part have effectively incorporated ERP arrangements into their business.

Because of ERP arrangements or other moderate ERP modules created by some kind engineers, these SME’s organizations can now maintain the budgetary needs to incorporate ERPs into their business. This aide the SMEs for smoother stock administration, time administration, human asset administration, keeping up item cycles and shipment of merchandise and furthermore in online information correspondence.

India’s financial development as to universal rivalry depends intensely on Indian organizations to incorporate and actualize ERPs. There ought to be sufficient mindfulness gliding through the air to tell them about the high benefit to cost proportion that ERPs can convey to an organization.

ERP showcase

As talked about before car and steel ventures demonstrate extraordinary enthusiasm for receiving ERP modules and Automobile, Steel, Engineering modules are some that show awesome potential market in the days to come.

Specialists have evaluated that by and large, the ERP showcase has encountered a development of almost 70% in the most recent decade alone while the market to has dashed to abnormal amounts of financial increases. Reports have been made that have underlined the obvious measurable advantages that Indian organizations experienced in the middle of the post-ERP execution period.

Conclusion

A reasonable helpful impact gave by actualizing an ERP can be judged if the organization in concern expresses their items before ERP execution and after that measure their accomplishment after ERP usage. This can give a superior understanding of the impacts of an ERP.

By the by, ERPs incorporate extraordinary elements that can ease up the workload for some organizations, at last, bringing about less demanding work and in this way in a roundabout way increment profitability. The way that the development rate of ERP usage in India is on the ascent implies that Indian organizations can now stand toe-to-toe with the worldwide rivalry.

For any queries on ERP Solutions or any guidance on selecting the right ERP Software for your business get in touch with us through sales@bistasolutions.com or to write your feedback on this blog post, you can reach us at feedback@bistasolutions.com

Automating business insights using Analytics

Data analytics (DA) is the process of examining data sets to draw conclusions about the information it contains, increasingly with the aid of specialized systems and software. 

Over the past few years, we’ve seen a remarkable growth of data analytics. organizations like, professional sports franchises, medical research institutions and much more, not even a single industry is untouched the use of data analytics. The analytics has changed the face of the market in every term.

Every organization is acknowledging the power of data, they are driving their business to the new heights with actionable decisions. Precisely, all the IT giants are not only getting the benefits from it also doing research and development to get the better prediction accuracy.

Using analytics and other data mining techniques, you can get the best insights from the data. So, let’s have a deep dive into it with their use cases.

Descriptive Analytics:

Descriptive Analytics are used to describe the basic features of the data with the help of analytical tools (i.e. R, SAS, Tableau) and other statistical methods. It provides simple summaries about the sample and measures.

Use case – I

Let’s start working with “Online Retail” dataset which is well known and very popular among us. we are taking this dataset for the sake of understanding.

Dataset reference link: https://archive.ics.uci.edu/ml/datasets/Online+Retail

So, below is the head of the retail transactional data which consist over 500 thousand records, having the daily transaction with eight different variables which can be seen below.

screen1

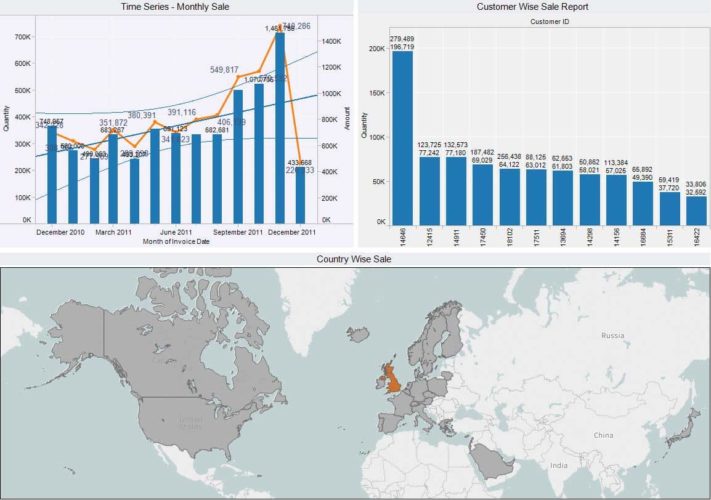
So, by using some basic visualization tools and techniques, now we have the basic information about the data, what data is about?

screen11

In the top left plot (i.e. time series – monthly sale), we can observe that in the month of November-2011 highest sale recorded compare to other months. The very next month Dec-2011 has the marginal drop in a sale. By analyzing this plot we can at least have the basic idea that there was something untrendy in Dec-2011. If we look at trend line which shows an upper trend, that means over the past months we have significant growth rate.

In the top right plot (i.e. customer wise sale report), the top customers are there on the list. We can focus to serve them as good as possible.

In the lower plot (i.e. country wise sale report), it’s a geographical plot for different countries based on sale generated for the region. The highlighted region “United Kingdom” is the country who is having the highest sale over the past year.

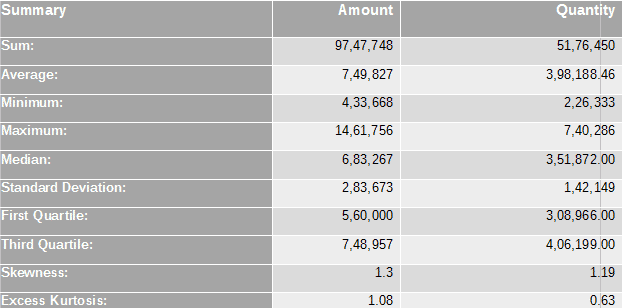
The table below gives us the basic idea about dataset with statistical attributes.

Summary table (transaction dataset):

screen3

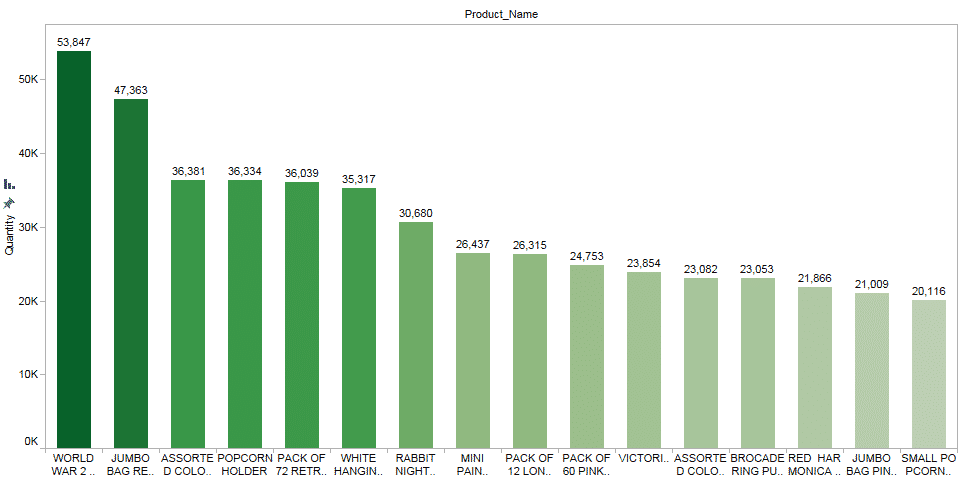
Below plot shows, the highest selling product in decreasing order.

screen4

Predictive Analytics:

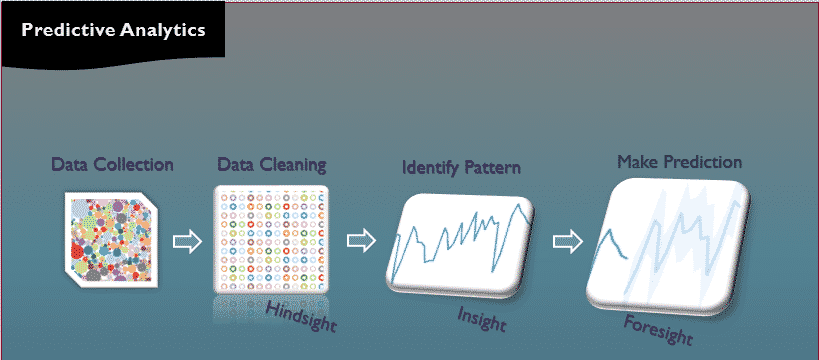
Predictive Analytics is the branch of advanced analytics which is used to make the prediction of unknown future events. It uses many statistical techniques, machine learning, artificial intelligence, data mining and modeling to make the prediction for unknown future events.

screen5

To understand the techniques of predictive analytics, let’s work with another use case.

Use Case – II

Here, I am using the “German Credit” data, having 1000 number of records and 21 columns, let’s see what information we can get from this data using predictive analytic techniques?

data reference link:
https://onlinecourses.science.psu.edu/stat857/sites/onlinecourses.science.psu.edu.stat857/files/german_credit.csv

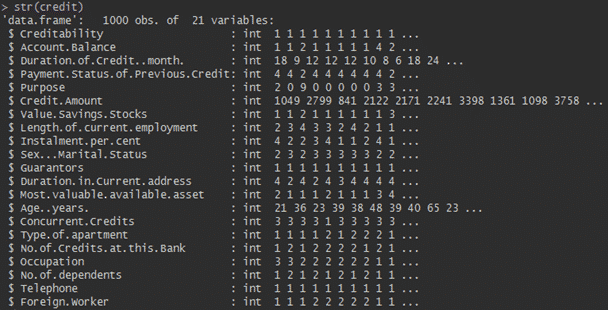
Below, the structure of the data gives us the overview, what data is about?

analytics

Applied first phase of analytics i.e. descriptive analytics. Now, here we are going to apply some popular predictive analytic techniques like regression model, decision tree etc.

Model – I

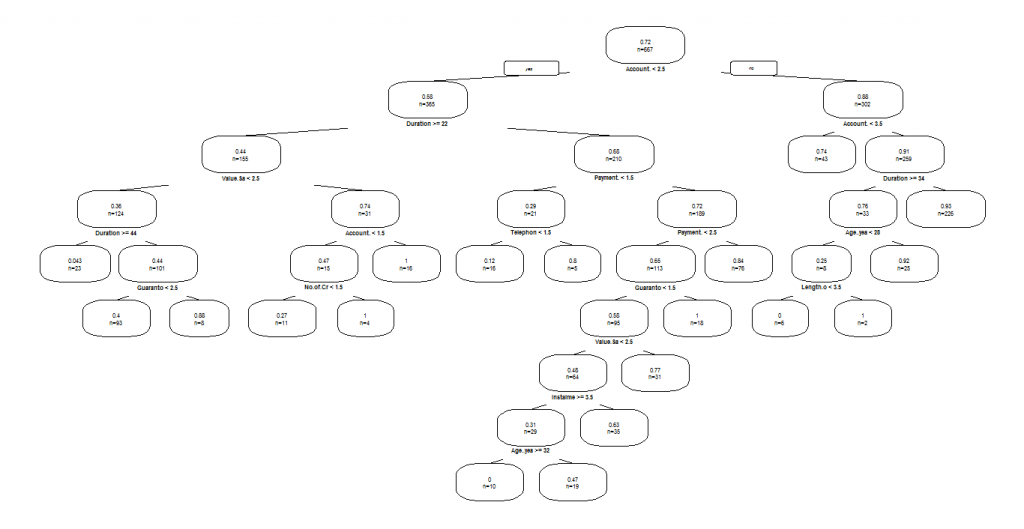
Decision trees: These are classification models that partition data into subsets based on categories of input variables. So, let’s apply DT on credit data.

screen7

Initially, we decide the target variable i.e. Creditability, later looking the impact of other variables on target variable and we can treat them accordingly.

Below, the DT plot from which it can easily identify the different levels and nodes of DT. The classification criteria for the different levels are calculated with the help of entropy.

screen8

Model – II

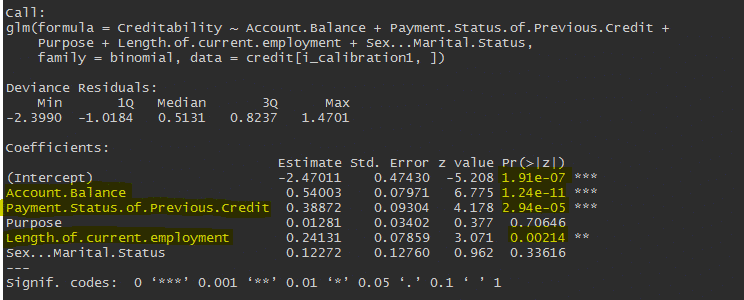
Regression (linear and logistic) is one of the most popular methods in statistics. Regression analysis estimates relationships among variables. So, let’s work with another model i.e. “Regression” on credit data.

Regression modeling in R, codes are below:

screen9

The regression output is shared below with some highlighted rows, which means those variables have the significant impact on credibility (i.e. variable of interest).

screen10

The highlighted variables have p-values less than 0.05 (significant level), which indicates that the variables have the significant impact on target variable.

Prescriptive Analytics:

Prescriptive Analytics is basically the area of business analytics which leads to increase the number of suggestions (options) for a current situation. It is related to both descriptive and predictive analytics. It optimizes decision and helps us to maximize profitable growth and mitigate the risk as well.

Case Study – III: Product Recommendation

E-commerce websites and applications, for example, make recommendations based on user data—such as Amazon or Netflix suggesting a product based on our interest or on our purchase history.

How does it work? Behind the whole process, the team of data scientists monitors model results. The analytic results, associated content, and delivery of said content are all controlled through an automated workflow which is nothing but an algorithm.

The brilliant part about this case example is that the models prescribe what to do (i.e., which product to recommend), and an automated system actually does it (i.e., the website tells you what to buy next).

This insight is already here, but the next step is even more exciting: solutions will also offer actual recommendations based on data to ensure good business decisions that will help organizations to reach their goals.

Conclusion:

The major goal of analytics is to help organizations and make them more informed business decisions in the form automated insights. After analyzing the large volume of different forms of data which may be untouched due to their complexity, this can include Internet clickstream data and weblogs, internet contents and social activity, survey responses and emails, sensor data connected with IoT.

For more insights on Business Analytics feel free to get in touch with us through sales@bistasolutions.com, you can also write your feedback on how this blog has helped you at feedback@bistasolutions.com.

Odoo V10: Show message recipients

Odoo V10

Introduction to odoo:

Odoo formerly known as OpenERP and before that tinyERP is a suite of enterprise management applications. Targeting companies of all sizes, the application suite includes billing, accounting, warehouse management, project management etc.

A few months ago only odoo V10 is launched with its new features. It is a platform for which we could say “All Applications Under One Roof”.

Show Message recipients:

This is the new application developed by us due to which you can never accidentally send emails. For odoo enterprise version 10.0 this module expands “Followers” into an editable list of recipients. You can see every contact who is currently following the document from which you are sending the message.

You can even add or remove people without affecting the followers, just be sure that email is only going to those who should be actually receiving it.

By the image described below, it clearly describes that how this module works actually i.e. whose so ever names are there in followers would be automatically reflected in recipients list. If some other names are to be added in recipients list, then they would not be reflected in the “Followers” name.

img1

For odoo enterprise V10 the workflow is as follows:

Firstly we need to install the module “Show Message Recipients”

img2

Secondly, for any sale order or any quotation page there is a button for “New Message” and by clicking on it a new wizard opens up for sending emails with the names of recipients the same as in the “Followers”

img3

The wizard will be seen as follows:

img4

This is how this module works and if we add extra recipients it would not be shown in the “Followers” list. This was all about odoo v10 “Show Message Recipients”, we hope this short snippet would have helped you in getting some insights of odoo. Stay tuned for more information on odoo.

Please feel free to reach us at sales@bistasolutions.com for any queries on odoo and its related modules. Also, you can write us through feedback@bistasolutions.com and tell us how this information has helped you.
Which Visualization Is Right For You?

Introduction

Every day we consume a lot of data, whether it is in our personal life or professional. Newspapers, magazines, websites, statistical reports, PowerPoint slides being the common platforms. The most common way data gets depicted is through graphs or visualizations. They capture the essence of what data is trying to tell you or to put it more dramatically, they provide a medium for data trying to talk to you and tell you a story. It is prudent that the visualizations chosen are apt because they may give a different meaning compared to what the data represents if chosen incorrectly. This choice becomes even more crucial when decision making is dependent on the inferences are drawn from the visualizations.

Choosing the right visualization for your Business

BI and visualizations tools have made creating graphs very easy in the recent years. Almost all organizations that rely heavily on data for decision making have done away with Microsoft Excel for creating visualizations. This is because of two simple reasons. One, the size of data being used has increased a million-fold. Second, most other tools provide more variety in the number of visualizations which enables users to choose the right graph for a specific dataset.

Most BI tools like Tableau, Power BI, SpagoBI, Qlikview, Jaspersoft give anywhere between 10-15 basic visualizations to choose from. The users can further customize to create more visuals. With so many new visuals being available and many getting added year on year, users face the dilemma of choosing the right one for the data being used. For example, there is a transactional dataset for a geography, say the United states. So, if the user wants to represent the transactions at the state level, using a Bar graph or column graph will give a good understanding of the which state has the least or most values. However, representing transactions at city level using the same type of graph is not advisable. The simple reason being the visual will be too cluttered to derive any action out of it. Instead, if a Map is used for representing that dataset, it is not visually appealing but also meaningful to derive information. Visuals are therefore only effective if the person consuming it can derive any action item or explore a cause-effect relationship.

Choosing the right visualization is indeed an important and difficult task. But the choices may be shortlisted by deciding what do you wish to convey through the visualization. These can be generalized into the following groups:

  1. Comparing Values

The following chart types can be used when comparing values or outlining the extreme values across the spectrum of the data:

    1. Column

    2. Bar

    3. Line

    4. Bullet

region

  1. Showing composition of data

This is widely used when the data has to be distributed into subcategories and thus show how each subcategory behaves within that dataset. The following chart types can be used:

    1. Pie

    2. Stacked bar/column

    3. Area

    4. Waterfall

showing composite data

  1. Show data distribution

When your dataset consists of multiple data points and outliers need to be identified or a certain range has to be defined to cluster your data, the following chart types can be used:

    1. Scatterplot

    2. Bubble chart

    3. Circular Views (specific to Tableau)

    4. Treemap

show data distribution

  1. Understanding relationships between groups of data

When you want to understand how one or multiple data points affect the other, the following charts can be used:

    1. Scatter plot

    2. Bubble chart

    3. Line

Understanding relationships between groups of data

You may see several charts being repeated in the above groups. This is because the same chart type can be used to gain different insights into the data. It would depend on the data points being used and the formatting of the chart. Furthermore, the data could be continuous or discrete and therefore most common charts like the line, bar, scatter plot can be used in more than one way.

When does a visualization Fail?

  1. The majority of the times users try to overfill a chart with too many data points, like in the case of a line or bar graph, which makes the visualization look cluttered. Because you cannot differentiate between two data points easily or they overlap the majority of the time, it becomes difficult for the user to deduce anything from that visual.

  2. Using too many colors makes the visualization overload with information. This would make the main focal points difficult to find or disappear altogether

  3. Using only one color would again make understanding the visual a time-consuming affair. Or it might contradict the information being deduced thus making the visual redundant.

  4. To put it simply, when the visualization being consumed takes more than 10-15 mins to understand and deduce any actionable items. This happens mostly because of a wrong choice of visualization.

We hope this visualization selection guide helps you drive your business in a much-organized manner. For more insights on Choosing the right visualization please feel free to get in touch with us through sales@bistasolutions.com , you can also write your feedback to tell us what you think about this blog at feedback@bistasolutions.com.

New features in Power BI

  • by bista-admin
  • Feb 16, 2017
  • 0
  • Category:

“Strive for continuous improvement, instead of perfection” – Kim Collins

We at Bista Solution have always believed and practiced the above quote and partnered with similar technologies over the time to provide the best in class deliveries to our Clients. One of the similar technologies i.e. Microsoft Power BI, which has evolved over the time and has helped us in providing advanced reporting features to our Clients. So, this time we have decided to highlight some of those new features which helped us well in our BI implementations.Let’s get started .

Power BI Feature # 1: Drop down Slicer

Handling slicer is one of the best features which enables the end user to slice and dice the report on a real time scenario. But over the time it was observed, In the case of large data the list was huge which consumed more space on the report and managing the same was a bit difficult. With the help of drop down slicer feature,  space management on the report was efficiently handled and the users have the flexibility to select only the options they want to make use of.

new2


Power BI Feature # 2: Data Labels Orientation

With this feature, we can change the orientation of the data labels texts

image05

i.e.from horizontal to vertical which is useful in designing compact visuals and columns.

Power BI Feature # 3: Table Header Wrap

When dealing with matrix or table visuals, we usually encounter scenarios where the column header was large and due to the table width, it always appeared partial and again to view it completely it was required to be resized

image01

every time by the user. With the help of the Table Header Wrap feature, the long text gets wrapped and it’s visible completely no matter how wide or short the table or matrix is.

Power BI Feature # 4: Aggregation in String and Date Columns

This feature helps in displaying the dates from earliest or latest option from the visuals and in the case of strings we can change the aggregation to first or the last in the same menu.


new1

Power BI Feature # 5: Snap to Grid

One of the most difficult challenges at times developers face is about aligning all the visuals well on the report Canvas. Also from a presentation point of view, even the end users expect a better and clean reporting visuals. So, to make this job easier, Snap to Grid feature, comes to the rescue. With this feature, the complete canvas is divided into grid lines with proper coordinates so that all the visuals are lined up properly with minimum efforts.

image02

Power BI Feature # 6: Matrix Conditional Formatting

As the name suggests, this Power BI feature helps in formatting data on the conditional basis, especially in a situation where we need to represent certain

image07

values with a particular color code based on certain conditions.


Power BI Feature # 7: Date Slicer

This new feature of Power BI helps in selecting date range from the slicers with options for Start and End date. This usually helps in fetching the data from certain date range which makes it more interactive to the user and gives more refined results from your data.

These are some of the updates of Power BI Features that we have implemented for our clients. As there are monthly updates which keep releasing we will keep sharing all our experiences in using the Power BI features from time to time. Do let us know your feedback on feedback@bistasolutions.com or you can reach out to us at sales@bistasolutions.com