Predictive Analytics

predective analysic

Introduction

Today we live with an exponentially ever-growing sea of data. To handle it safely, we use analytics. Without analytics, we would simply drown into the sea of data, not aware what happened or what coming next, the size and source of the data are just expanding unexpectedly. One of the most important branches of analytics is predictive analytics, it has made some sense of storing data. 

Are you aware of predictive analytics technology? If not, get ready. It is the next big revolutionary thing that will propel the world beyond the imagination—and in many respects, it is already in between us. Predictive analytics is the use of statistics, machine learning, data mining, and modeling to analyze current and historical facts to make predictions about future events.

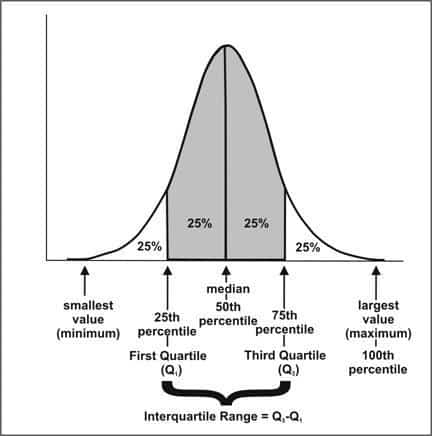
Important Values of Predictive Analytics

Establishment of Effective Customer Relationship- “now you know your customers

Using the predictive analytics, you can meet your customer needs and target the most benefit cable customers, how you can do this? Here we answer the doubts which are coming into your mind, how predictive analytics helps you to establish a relationship with the customers and helps you to grow your business? Is such a thing even possible? Or Such things have any existence or not?

The predictive analytics (predictions) doesn’t have to be all that accurate to grow or improve your business or to target the profitable customers. “This all about numbers and it’s a number game as always” and predictive analytics used to play it as well and it translates it’s a high return and doesn’t depend on highly accurate predictions      

Let’s understand it in other ways, suppose if predictive analytics identifies 3 times more likely to defect than average customer segments, you can target those segments accordingly. If your overall defection rate is 5%, the segment we’ve discovered has a higher detection rate of 15%, so, in this case, we’re not actually confident in predicting whether any one individual customer will defect or what, the analysis identifying this kind of customer segment which is predicted in aggregate which behaves differently compared to your overall customer base. And now by knowing the different segments of your customers you can understand them more as compared to the past, you will come to know their expectations their needs and have the better relationship by offering them your evaluated services.

Now, the very next question is coming into your mind is how these valuable customer segments are discovered? To get the answer to this question I would suggest you uncover your computer and sooner or later you may get the answer, I must be joking! Yes, I am. This is the magic of “predictive analytics”, It works on past historical data with a huge number of statistical models which leads to delivers magical results and by that your business decision more accurate and healthy in prospects.

The table below lists predictive analytics business applications.

Business application: What is predicted:
Customer retention customer defection/churn/attrition
Direct marketing customer response
Product recommendations what each customer wants/likes
Credit scoring debtor risk
Insurance pricing and selection applicant response, insured risk

And there are many more applications of predictive analytics, including collections, supply chain optimization, human resource decision support for recruitment and human capital retention, and market research survey analysis.

Offering New Services and Products 

Somehow If we could predict the future, we would be able to read the minds of our customers as well and will come to know exactly what they wanted.  The closest we can get to this supernatural ability is utilizing predictive analytics to tap into the hidden information that resides into a big data. 

To understand this, we have an example of insurance sector which is widely using this technology and changing their offerings, launching policies almost every day, based on their analysis.  

     Risk Management- “we are here to care…. leave it on us”

A famous philosophy works in Risk Management is to “work smarter, not harder”, but How? By implementing the most efficient tools like as Predictive Analytics with your existing system. 

The predictive analytics playing the vital role in mitigating the risk in all sectors which are associated with our day to day life, let us take an example to understand it in depth.

Let’s have an example of the bank, as we know the banking sector is very risky and hard to handle or predict the risk based on your experience or intuition, the predictive analytics allows you to embed advanced fraud detection models directly into your database applications. By introducing predictive analytics into your database or transactional systems, a percentage of fraudulent transactions can be detected at the time they are being processed and before payment. The result is a significant reduction in costs associated with fraud both within the organization and to the customer.

predictive analysis

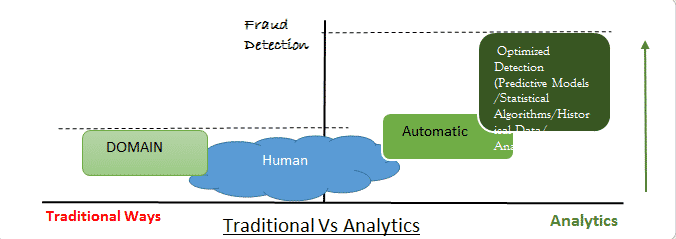
Before the predictive analytics, we were dependent on our intuition and domain training, and that was not enough to stop the fraudulent activity after introducing the predictive analytics we are more powerful and efficient to deal with it in several ways.

Why do You need to Trust on Predictive Analytics to Improve Risk Management?

The “Predictive Analytics” plays a vital role in risk reduction in various fields such as insurance and healthcare industries. As per the report of “Predictive Solutions publication”, the predictive modeling has high accuracy levels between 80 percent and having accuracy about 97 percent in predicting future worksite injuries based on existing data. The use of predictive analytics introduces a very professional way of safety and prevention and it leads to risk reduction. 

Different Areas Where We Can Have Predictive Analytics Risk Management:

  • Sales and Marketing.
  • Fraud: Fraud is one of the measuring areas where we must have predictive analytics to reduce risk and covers healthcare fraud, credit card fraud and much more.
  • Insurance: It’s a sector where Predictive Analytics has its own importance.
  • Healthcare Industries. 

      Inventory Optimization – “no more over or under stocking

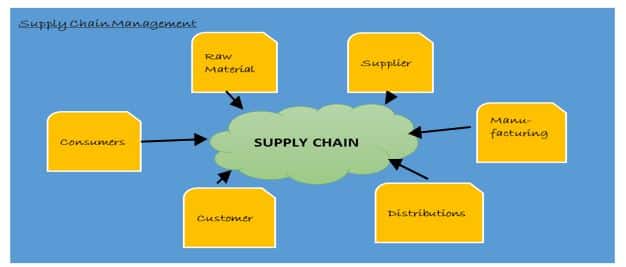
As we all know, Predictive analytics uses various techniques to analyze past historical data to make predictions about future. One of the major areas which we can deal by applying the technologies and analysis is supply chain. The biggest challenge that the companies facing is accurate demand forecasting or to manage their inventory. This can be solved up to a certain level if technology and analysis can help to determine customer’s usage and buying nature. 

Let’s understand it with a simple example, in any product based company there needs to manage their supply chain and it has a different unique level of a supply chain, that is shown in fig

Of course, the secret to good forecasting is to keep doing it over and over until you get it right or closer to your expectations.  Forecasts should be continuously updated and incorporate time frames that may be several years out (to anticipate the obsolescence issues), mid-term forecasts that drive our financial investments in plants and new products, and near-term forecasts that drive actual production and procurement.

supply chain


How is the Predictive Analytics Helping Hand to Managing Supply Chain?

  • Demand Analytics – How is my forecast leading with actual data.
      • Detailed demand forecasting at the different point of sale.
      • Tune the forecast with integration of promotional events and holidays
  • Inventory Optimization – What stock should I hold and where should I position it.
      • Inventory budget optimization
      • Safety stock level recommendations
  • Key Things Which We Need to Avoid Before Working with Predictive Analytics:
  • Don’t confuse more data more insights:  The volume of data is not always proportional with the insights of the data and their values.
  • Don’t overestimate the ability to interpret the data:  Sometimes even the best data may afford only limited insight that doesn’t mean data is inappropriate.

Scope of Predictive Analytics – “Beyond the Predictions”

What Have We?

Predictive Analytics have already earned so much popularity in almost every sector like sales & marketing, e-commerce, insurance, banking, healthcare, CRM and much more due to its high level of accuracy and advances in computing technology, techniques used for analysis, advanced mathematical and statistical modeling.

  • Tomorrow’s Just a ‘Day’ away
  • Trend to monetizing data becomes, even more, ubiquities
  • A new area of data sources will come forward: Internet of Things, Wearables, Beacons, …
  • No need to have the expertise level of knowledge to handle the things.
  • Automatic Business Modellers will come in front.
  • Predictions of Business Decisions.
  • The Future of Prediction Analysis

The entire community of ANALYTICS is working every second of time to improve an accuracy of prediction and to improve future of prediction, sooner or later we will see the revolutionary change. Just Wait and Watch!!

Please feel free to reach us at sales@bistasolutions.com for any queries on odoo and its related modules.Also, you can write us through feedback@bistasolutions.com` and tell us how this information has helped you.

Odoo 10 MRP: Advanced Traceability

  • by bista-admin
  • Feb 02, 2017
  • 0
  • Category:

Introduction to odoo v10:

Odoo formerly known as OpenERP and before that tinyERP is a suite of enterprise management applications.Targeting companies of all sizes, the application suite includes billing, accounting, warehouse management, project management etc.

A few months ago odoo v10 is launched with its new features. It is a platform for which we could say ”All Applications Under One Roof”.

Odoo 10 MRP Features:

In the manufacturing module both in enterprise and community edition of odoo v10, Odoo has provided some ‘Extra Features’ such as maintenance, quality control, MPS (Master Production Schedule) etc. These features justify that Odoo 10 is a complete package for managing your manufacturing process effortlessly with no complexity of integration with different software to take care of the quality or the maintenance phases.Let’s first understand these features in detail one by one:

  • Odoo 10 production:

    The major change which is made by odoo 10 to the module “Production” is that now it has MPS (Master Production Schedule).This is used to know the no.of items that are to be produced, the planned inventories of the raw material, finished products etc.

It also plays an important role in the balancing of demand with the supply i.e satisfaction of customers.

manufacturing

  • Odoo 10 PLM: –

  • This module is there for supporting routings, and nomenclatures. Basically, PLM application allows us to-

  • Make manufacturing order route revision

  • Generate alerts for changes in BoM’s as well as routes in MO(Manufacturing Order).

  • Generate multi-level approvals from higher authorities for any revision before making changes in MO.

plm

  • Advanced quality control procedures.

  • Rejection flow for rejected products.

  • Masters for quality defined operations.

  • Flow for quality approval

maintainence

Odoo 10 MRP: Traceability

Traceability is a term which is used for checking the history of products and lots.In the products from view also there is a smart button of ‘Traceability’ which will always show history regarding how much products comes/goes out/inventory and all.

Lots: OpenERP online can also manage product lots.Two types of lots are defined-

  • Serial numbers: These are represented by a unique product or an assembly of identical products.They are usually identified by barcodes stuck on the products.The batch of products can be marked with a supplier number or your own company numbers.

  • Tracking numbers: These are logistical lots to identify the container for a set of products.

The double entry management in odoo ERP online enables you to run advanced traceability(upstream and downstream traceability)

Upstream Traceability: It runs from the raw materials received from the supplier and follows the chain to finished products delivered to customers.

Downstream Traceability: It follows the product in the other direction from customer to different suppliers of raw material.

maintainence2

We can also find this option of ‘Traceability’ in the products form view

 sales

sales2

This was all about odoo Mrp Traceability, we hope this short snippet would have helped you in getting some insights about odoo.

Stay tuned for more information on odoo.

Please feel free to reach us at sales@bistasolutions.com for any queries on odoo and its related modules.Also, you can write us through feedback@bistasolutions.com and tell us how this information has helped you.

Odoo Website Builder: Benefits & Features

Odoo Website Builder cover

Introduction:

Odoo website builder is an easy and customizable application through which customers can create their own website and can edit anything online. There is no technical knowledge required for creating a website.

Features of odoo website builder:

1. Attract new visitors efficiently

2. Designer Templates

3. Edit anything Inline

4. Multi Languages Made Easy

5. Professional Odoo website templates

Let’s understand each one of them one by one:

  • Attract new visitors efficiently:

Whenever any new viewer visits the website he/she is automatically attracted by the various new features of the website builder. The promote tool suggests keywords according to google’s most searched terms. Search engine optimization tools are ready to use with no configuration required.

  • Designer Templates:

Templates are awesome and easy to design. There is no need to create and develop new pages, themes or building blocks but you can simply use bootstrap CSS.

  • Edit Anything Inline:

Odoo’s unique technique of ‘edit inline approach’ makes website creation surprisingly easy with no more backend required and can just click anywhere to change the context

  • Multi Languages Made Easy:

You can get your website translated into multiple languages with no efforts. Odoo propagates translations automatically across pages, following what you edit on the master page.You can update any part of your website and the translated versions are pushed within few hours.

  • Professional Themes:

With Odoo website builder, you can design your custom theme or you can also use predefined Odoo website templates to customize the look of the website. You can just in one click change the theme of the entire website.

Odoo E-commerce Website

Odoo ecommerce website is just like modern open source online store through which you as the owner can create custom designs for product pages to showcase one’s business in a unique way. You can even add product attributes such as color, size and style to keep product lines easy to navigate. You as the owner can also edit product pages with ease so that the product information is displayed in the way you want to see it.

With an integrated e-commerce platform, inventory and sales can also be maintained via automatic stock adjustments and reporting. Dedicated customer portals help to keep customer data organised with order tracking and claims allowing customers to download invoices and delivery orders as well as view pending shipments from a single location.

Features of Odoo website builder:

Basic Features:

  • Design an attractive homepage

  • Create a blog

  • Set up a webshop (ecommerce)

Let’s have a look at what these features actually do in-depth

  • Designing Attractive homepage

  • General presentation of Odoo website builder

  • Edit menu and structure your pages.

  • Use drag and drop building blocks

  • Resizing and positioning elements on your page.

  • Blogging

  • Install the blog app

  • Activate more blog functions and edit our first blog post.

Odoo website builder blogSetting up workshop:

  • Install e-commerce application

  • Manage your products

  • Online sales are visible in our system

  • Entirely integrated with our odoo system i.e managing sales, warehouse and invoicing as usual.

Odoo website builder online shop

This was all about odoo website builder, we hope this short snippet would have helped you in getting some insights about odoo.

Stay tuned for more information on odoo.

Please feel free to reach us at sales@bistasolutions.com for any queries on odoo and its related modules.Also you can write us through feedback@bistasolutions.com and tell us how this information has helped you.

Odoo Mobile Applications

  • by bista-admin
  • Jan 25, 2017
  • 0
  • Category:

ERP often covers every part of business operations from inventory, HR to CRM, until the office desktop became the sole domain of ERP, the only spot where a massive amount of data and large complex business functionality would fit.

All of that is shifting with the introduction of enterprise mobility. Businesses can now see that confining data and capabilities to the office is not the best way to move forward in an increasingly agile business world where mobile ERP capabilities exist. The best way to progress into a new reality is to develop enterprise mobile apps that can provide functionality while on the move. Having mobile access to business capabilities brings a pronounced benefit to the enterprise. Here are some of the advantages that will help you see why a company needs a mobile app.

  • Mobile Apps streamline and simplify cumbersome and monotonous tasks. It makes more proactive and stronger bonds with vendors, customers, and employees.
  • Businesses who employ ERP Mobile Apps have an advantage over their competitors. Customers today expect businesses to employ cutting-edge technology to deliver timely, high-quality services at the lowest possible cost.
  • Mobile apps reduce downtime and allow the team to be more productive with their time.
  • Mobile Apps consolidate information from many departments into a single database, allowing team members to work more effectively.
  • ERP Mobile Apps make it easier and more convenient to enter critical data accurately while on the job.
  • Mobile Apps make it easier to keep track of suppliers and inventory data at your fingertips, streamlining the entire supply chain.
  • Mobile apps assist in making the proper data-driven decisions from anywhere in the world by allowing speedier verification.
  • Mobile Apps facilitate intra-departmental communication, resulting in increased engagement.

Odoo Mobile app:

We are very well aware that Odoo is the future of business solutions due to its extensive features and flexibility to build modules to match the specific needs of each enterprise. With its Mobile applications, Odoo offers a spectrum of mobility options. It’s available in the Apple and Google App Stores, and it follows enterprise-level security and distribution best practices.

Odoo Mobile app is flexible and can streamline the business process with no compromise on operational efficiency. By providing leadership and employees with the tools they need to flourish, the Odoo mobile app solves several challenges.

Odoo Mobile app development can help you expand your business.

Odoo Mobile ERP Apps 

Some of the Odoo Mobile Apps’ Features:

  1. Easy Setup- Only one-time setup is required- Setup and configure your app with the Odoo backend once and you’re ready to go.
  2. Enable Offline Access- Odoo Mobile apps include offline capability, which allows users to save performed activities and sync them with Odoo ERP after the connection is restored. It enables the user to complete the activity sequentially even when there is a connectivity issue.
  3. Seamless Integration- Odoo Mobile apps offer unique features, such as fingerprint sensors, cameras, location detection, and transaction history. Simply submit the transaction receipt, and the ERP will use artificial intelligence to record it as a cost.
  4.  Automatic Synchronization- Changes made in the Odoo Mobile app are instantly updated and synchronized with the server, eliminating the need to update manually.
  5. Extended Functionality- The Odoo Mobile App makes it simple to add new features and capabilities to the Odoo ERP platform. With the assistance of a developer, it is quite simple to customize features in the Odoo mobile app.
  6. Compatible- Odoo’s mobile app is fully compatible and optimized for both iOS and Android devices.
  7. Real-Time data- Odoo Mobile app provides real-time information such as push notifications, real-time feed, instant messaging, and tracking live order status. When your company combines Odoo ERP with its mobile applications, you have limitless access to required and accurately updated data and information in real-time, making it incredibly easy to obtain crucial information at any time.

Why is Bista the best option for your Odoo Mobile App development?

Experience- For a long period, our firm has assisted countless businesses from various sectors. This allowed us to build expertise in everything related to Odoo and understand a business’s specific requirements for crafting the best solution for your firm.

Expertise- Before becoming a member of our team of experts, every Odoo ERP specialist has to go through a rigorous screening and training process. This gives us the confidence to do what we’re doing.

Support- Every business needs experienced help with Odoo ERP implementation, especially with the mobile app development function. Our Odoo ERP support team is always accessible to help you with any issues you may have. Always enlist the help of a professional!

Using Odoo Mobile apps can provide several benefits to your firm. With the help of Odoo mobile applications, your employees will be able to handle all of the essential business information from a mobile device with ease. It allows you to receive all of your company information on the move. It aids in the mobilization of information across several places, resulting in increased corporate agility. It’s up to you to decide whether you want a full-fledged Odoo mobile ERP or a standalone app that integrates with your main ERP system. Contact Us for more information.

Spend less time on ETL and more time on analytics using Data Blending

Introduction

Bista Solutions had always been ahead in terms of adopting new technology and ongoing trend especially in the BI industry. For projects having short deadlines and Customer who don’t prefer spending more on the ETL part, we at Bista solutions had opted for Data Blending option for such special customers. After the successful implementation for one of our esteemed Client, we would like to share our experiences in using Data Blending.

Before we start, let’s understand what exactly Data Blending refers to? Data Blending is basically a process of combining the data from multiple data sources into a proper useful data set which can be used efficiently for reporting and analytics.

Challenges faced:

So as per our Customer requirement, the core data was required to be fetched from Postgresql and since they wanted to capture daily Currency rate fluctuations so we had to also fetch data from their website and to record their historic data it was also required to connect to the Hive database. As a part of the visualization, all this data from different sources had to be analysed and used in a single report. So, under this scenario, we initially opted for ETL to combine all three sources of data and point to a single data set. But it was difficult to implement due to time constraint and budget cost.

Solution provided:

To provide a better solution we had to explore and implement the Data Blending option which not only helped us in saving time but also made us to deliver the product on time without compromising on the quality. Tools which really helped us in implementing the same in our multiple projects were

  1. Tableau
  2. Microsoft Power BI

As per our experience on this tools, they were helpful in implementing the Data Blending concept for our Clients. The flexibility of self-service BI along with data blending facility gives a completely new edge in implementing a powerful BI solution.

Let’s understand why we didn’t preferred joins over Data blending.

  • Data needs cleaning.

On the off chance that your tables don’t correspond with each other effectively after a join, set up information hotspots for every table, make any vital customizations (that is, rename segments, change segment information sorts, make bunches, utilize figurines, and so on.), and afterward utilize information mixing to consolidate the information.

  • Joins cause copy information.

Duplicate information after a join is a side effect of information at various levels of detail. On the off chance that you see duplicate information, rather than making a join, utilize information mixing to mix on a typical measurement.

  • You have loads of information.

Commonly joins are prescribed for consolidating information from a similar database. Joins are taken care of by the database, which permits joins to influence a portion of the database’s local capacities. In any case, in case you’re working with extensive arrangements of information, joins can put a strain on the database and essentially influence execution. For this situation, information mixing may offer assistance. Since Tableau handles joining the information after the information is collected, there is less information to consolidate. At the point when there is less information to consolidate, by and large, execution moves forward.

Note: When you mix on a field with an abnormal state of granularity, for instance, date rather than a year, questions can be moderate.

Also during implementation, we came across some Prerequisite like,

Your data must meet the following requirements for you to use data blending.

Primary and secondary data sources

Data Blending requires an essential information source and no less than one optional information source. When you assign an essential information source, it works as the primary table or principle information source. Any consequent information sources that you use on the sheet are dealt with as an auxiliary information source. Just segments from the optional information source that have relating matches in the essential information source show up in the view.

Utilizing a similar case from above, you assign the value-based information as the essential information source and the quantity information as the auxiliary information source.

Note: Cube (multidimensional) information sources must be utilized as the essential information source. 3D shape information sources can’t be utilized as an auxiliary information source.

Characterized relationship between the essential and optional information sources

In the wake of assigning essential and optional information sources, you should characterize the basic measurement or measurements between the two information sources. This normal measurement is known as the connecting field.

Proceeding with the case from above, when you mix value-based and amount information, the date field may be the connecting field between the essential and auxiliary information sources.

  • If the date field in the essential and optional information sources have a similar name, Tableau makes the relationship between the two fields and demonstrates a connection symbol ( ) beside the date field in the auxiliary information source when the field is in the view.
  • If the two measurements don’t have a similar name, you can characterize a relationship that makes the right mapping between the date fields in the essential and auxiliary information sources.

Benefits:

With the help of Data Blending our BI solution offered flexibility to connect to multiple data sources and visualize it under the same report which not only made it more attractive but also helped in a productive way for our Customer which was missing before in their existing system. So now our customer could visualize their historic data and the value of the same under certain Currency exchange daily. Last but not the least it helped us in budgeting project cost up to 20% which was allocated for the ETL process. With this implementation, we strongly recommend our Clients for Data Blending and well confident to implement and bring value to your business data as well. If you are looking for any such type of Implementation or require any further details on the same, you can reach out to us on sales@bistasolutions.com , Also if you have any feedback or suggestion then mail us at feedback@bistasolutions.com    

Statistical Outliers: Detection and Treatment

Statistical outliers

Most real-world datasets include a certain amount of anomalous values, generally termed as ‘outliers’. These observations substantially deviate from the general trend therefore, it is important to isolate these outliers for improving the quality of original data and reducing the adverse impact they have in the process of analyzing datasets. Practically, nearly all experimental data samples are likely to be contamination by outliers which reduce the efficiency, and reliability of statistical methods. Outliers are analyzed to see if their unusual behavior can be explained. Sometimes outliers have “bad” values occurring as a result of unusual but explainable events. The cause of outliers are not always random or chance. Therefore a study needs to be made before an outlier is discarded.

Detection of Statistical Outliers

Statistical outliers are more common in distributions that do not follow the normal distribution. For example, in a distribution with a long tail, the presence of statistical outliers is more common than in the case of a normal distribution.

The simplest method of identifying whether an extreme value is an outlier is by using the interquartile range. The IQR tells us how spread out the middle half of our data set is.

The interquartile range, or IQR, is determined by subtracting the first quartile from the third quartile.

interquatile range

We start with the IQR and multiply it by 1.5. Then subtract this number from the first quartile and add this number to the third quartile. These two numbers from our inner fence. For the outer fences, we start with the IQR and multiply it by 3. We then subtract this number from the first quartile and add it to the third quartile. These two numbers are our outer fences.

Statistical outliers

Outliers can now be detected by determining where the observation lies in reference to the inner and outer fences. If a single observation is more extreme than either of our outer fences, then it is an outlier, and more particularly referred to as a strong outlier. If our data value is between corresponding inner and outer fences, then this value is a suspected outlier or a weak outlier.

Example

Suppose that we have calculated the first and third quartile of our data, and have found these values to be 40 and 50, respectively. The interquartile range IQR = 50 – 40 = 10. Next, we see that 1.5 x IQR = 15. This means that the inner fences are at 40 – 15 = 25 and 50 + 15 = 65. This is 1.5 x IQR less that the first quartile, and more than the third quartile.

We now calculate 3 x IQR, that is, 3 x 10 = 30. The outer fences are 3 x IQR more extreme that the first and third quartiles. This means that the outer fences are 40 – 30 = 10 and 50 + 30 = 80.

Any data values that are less than 10 or greater than 80, are considered outliers. Any data values that are between 10 and 25 or between 65 and 80 are suspected outliers.

Reasons for Identifying Outliers

The presence of outliers indicates errors in measurement or the occurrence of an unexpected and previously unknown phenomenon. It is extremely important to check for outliers in every statistical analysis as they have an impact on all the descriptive statistics, as they are sensitive to them. The mean, standard deviation and correlation coefficient in paired data are just a few of these types of statistics. This could mislead analysts into making incorrect insights as all these statistics get distorted.

NOTE:

Certain statistical estimators are able to deal with statistical outliers and are robust, while others cannot deal with them. A typical example is the case of a median. It is the most resistant statistic with a breakdown point of 50%. Which means that as long as no more than half the data are contaminated or missing, the median will not deviate by an arbitrarily large or small amount.

In practice, an outlier could cause severe damage to data-driven businesses. For example, outliers in transactional data of retailers or distributors could lead to the incorrect calculation of demand forecasts. Leading to a mismatch of demand and supply as the business either ends up understocking and overstocking its inventory. Other adverse outcomes could also include; inaccurate budget planning, non-optimum resource deployment, poor vendor selection, loss-making pricing model et cetera.

Even engineering firms or manufacturers can be adversely affected by outliers. Errors in measurement taken from sensors (eg. thermometers, barometers) during quality checks of the products produced, could result in unexpected failure of products, incorrect measurement of warranty periods, initiate re-designing of products et cetera.

The adverse effects of outliers could even influence the life of citizens when data collected by the government contains outliers. Biased samples in government surveys, containing observations which would’ve been considered outliers when compared to the entire population, could justify the formulation of policies that could damage society. Thus, it is imperative to devise methods of dealing with outliers in statistical analysis.

Treatment of Outliers

The treatment of outlier values can be achieved by the following categories of actions that can be taken:

  1. Transformation of Data: Transformation data is one way to soften the impact of outliers since the most commonly used expressions, square root and logarithms, affect larger numbers to a much greater extent than they do the smaller ones. Transformations may not fit into the theory of the model all the time as they may affect its interpretation. Transforming a variable does more than make a distribution less skewed; it changes the relationship between the variables in the model.

  2. Deletion of Values: When there are legitimate errors and cannot be corrected, or lie so far outside the range of the data that they distort statistical inferences the outliers should be deleted. When in doubt, we can report model results both with and without outliers to see how much they change. Data transformation and deletion are important tools, but they should not be viewed as an all-out for distributional problems associated with outliers. Transformations and/or outlier elimination should be an informed choice, not a routine task. In some cases, the removal of an outlier value can also induce incorrect inferences made about the data. In such cases, replacing the observation with a measure of central tendency (Mean, Median or Mode), depending on the situation.

  3. Accommodation of Values: One very effective plan is to use methods that are robust in the presence of outliers. Nonparametric statistical methods fit into this category and should be more widely applied to continuous or interval data. When outliers are not a problem, simulation studies have indicated their ability to detect significant differences is only slightly smaller than corresponding parametric methods. There are also various forms of robust regression models and computer-intensive approaches that deserve further consideration.

If you’d like to implement software involving forecasting for your business, you can reach out to us using our contact form or at sales@bistasolutions.com.

Odoo Request for Quotation Merge App

Odoo-Request-for-Quotation-Merge-App-bista
  • by bista-admin
  • Jan 09, 2017
  • 0
  • Category:

Introduction:

Odoo 10 is the most revolutionary ERP present in the market with its amazing features and user-friendly interface. With the help of the odoo team, partners, and all contributors worldwide odoo has evolved at a very high pace.

Odoo Apps:

There are various apps in odoo both for community and enterprise editions related to manufacturing, e-commerce, accounting, sales, purchases, etc. These apps are divided into the category of free/paid ones.

Request For Quotation Merge App:

For odoo community and enterprise versions, this app supports combining or merging requests for quotation documents. When we have multiple quotations for the same vendor it can be useful to merge them all into one before creating a purchase order and sending it. A new request for quotation with a new reference is generated and the originals are canceled. Merging works if multiple vendors and quotations are selected. If multiple vendors are selected, one merged quotation per vendor will be created.

How does Quotation Merge App Work?

Step 1: Create one request for quotation:

For example: In the below screenshot we could see a request for quotation is created with currency and warehouse location to be filled as mandatory.

purchases

Step 2: Create a second request for quotation:

Considering the same vendor name, currency, and stock location another quotation is created

Create second request for quotation

Step 3: Select and Merge Quotations:

After the creation of quotations select both of them from ‘Treeview’ following the below navigation

Action –> Merge Request for Quotation

A pop-up window will appear in which we need to check whether the conditions are followed or not unless merging could not be done

Select and Merge Quotations 1 Select and Merge Quotations 2

Result:

As the conditions are followed so simply click on the ‘Confirm Merge ‘ button and customers will see that a new purchase order with a new reference number has been generated which includes the merging of both quotations.

result

This was all about the ‘Odoo Request For Quotation Merge App’.We hope this snippet of the Quotation Merge App helps you to get some insights into odoo. Stay tuned for more information on odoo.

Please feel free to reach us at sales@bistasolutions.com for any queries on od0o and its related modules. Also, you can write us through

feedback@bistasolutions.com and tell us how this information has helped you.

Top 5 Big Data Trends 2017

big data
  • by bista-admin
  • Jan 06, 2017
  • 0
  • Category:

2016 was a landmark year for big data with more and more organizations switching to big data for storing, processing, and extracting value from data. In 2017, systems that support large volumes of both structured and unstructured data will continue to rise.

1.Big Data becomes Faster and Easier.

With all the buzz that has been surrounding Big Data and Hadoop technology over the major advantages they have which includes performing sentiment analysis and machine learning with the support of AI, Hadoop still had certain shortcoming which was the ability to support interactive SQL. SQL has of course been the means through which business users access Hadoop faster for exploratory analysis. This need for SQL fueled the adoption of faster databases like MemSQL and Cassandra, Hadoop-based stores like Kudu. With these boosters, Hadoop will now become as powerful as traditional warehouses with respect to use of SQL and advanced analytics

2.Big Data will grow more than just Hadoop in 2017.

With growing need of organizations to access data from various sources ranging from cloud warehouses, to structured and unstructured data sources, Big data will no more remain just with Hadoop. Businesses that rely only on Hadoop will have to use a variety of tools and infrastructures to perform advanced analysis and find answers to some critical questions. They will need data preparation tools, data cleansing tools, predictive analysis and various other analytical algorithms and so on so forth.

The Apache Spark, although it is in its primitive stages it has by far evolved to be a complete package to meet all these requirements.Apache Spark has a unique in-memory capability that supports a wide variety of data processing workloads.This in-memory storage enables applications low latency computation and to implement efficient iterative algorithms. In 2017 Customers will demand analytics and insights of all sizes and types of data. And so only those platforms which are capable of evolving to fulfill these needs will rise and continue to grow with Big Data.

3. Hadoop will no longer be just a batch-processing platform for Data Science.

Hadoop has now become a multi-purpose engine to perform ad hoc reporting. Hadoop can also perform operational reporting on day-to-day workloads which were earlier looked after by traditionally data warehouses. In the years to come, Hadoop will conquer all its shortcomings and be equal in power to probably be able to replace the existing and age-old techniques of reporting with an extremely easy user interface and self-service BI capabilities. Hadoop will create new opportunities for self-service analytics. In the years to come everything will become sensor controlled and everything will have its convergence from IoT which generates massive amount of structured and unstructured data which will be deployed and stored over cloud, as a result of which Big Data and Hadoop tools will have to fasten their speed to meet the growing demands for analytical tools that seamlessly connect to and combine a wide variety of cloud-hosted data sources.

4. Deep Learning Algorithms will Add Value to Big Data

Big Data can get even more valuable in the years to come if Deep Learning Algorithms continue to grow the way they are right now. Already Deep Learning Algorithms have the capabilities to recognize patterns in the video, audio, speech, image and other non-textual data. Well having said this there is a lot more that Deep Learning Algorithms can do! It will be no wonder if one day along with recognizing the image or objects these algorithms will be able to understand what is happening in the image or video and probably be able to have a human-like brain to analyze and take actions according to the situations.

5. Last but not the Least “The BlockChain Technology promises”

Have you all wondered where does Big Data come from? And Can this data be trusted? And how do we ensure that this Big Data is not a Big Bad Data? With the amount of data that is being generated from heterogeneous sources and the rate at which it is being generated the probability of this data being erroneous has also gone up to great extent. So what can we do to ensure that this powerful capability? We have to aggregate terabytes of data is, in fact, producing correct big data? It would be so nice if we never had bad data entering our databases. All these possibilities can come true if BlockChain Technologies stands by its promises.

Today, as a matter of fact, we all know that the Internet is a global repository of information but the need of the hour is that we need a global and a secure ledger of truth. A ledger that is not corruptible by any human fraud or is not subjected to any manipulation by any group, corporation, company, or even government for that matter. And this ledger is BlockChain Technology.

Blockchain Technology will basically help all industry where digital transactions are involved, this ranges from the financial industry to the legal industry to the real estate to the notaries, to gambling or even to publishing to data storages. In 2017 there will be a wider adoption of the blockchain technologies as most of the banks have already started investing and experimenting blockchain technology to ensure secure transactions.

Well, we hope this snippet of some predictions of Big Data Trends in 2017. It help your organization to invest in right things at the right time and be up front in this race of emerging trends and technologies. Stay tuned for more insights on Big Data and its related ecosystem at BistaSolutions.com.You can also get in touch with us through sales@bistasolutions.com and write to us at feedback@bistasolutions.com.

Why Investing in Big Data is the new competitive advantage

Big Data

Advantages of Big Data

Big Data has now become the new thing that will make a few companies leapfrog the others to become the best in class service provider in the market. Data is now prone to be generated by every sector of the global economy, In Fact, data has become such a vital factor that like other essential factors of production which include hard assets and human capital, much of the modern economic activity cannot take place without data.

In the current business environment, that is affected by proliferating data, dwindling budgets and developing customer demands, companies that make the right decisions at the right time have a competitive advantage. The ability of the companies to obtaining actionable insights will leverage the amounts of data that floods into the organization of all variety. Big data analytics provides the insights that help businesses make more informed decisions by using a combination of past data, responding to current business needs in real-time, and predictive modeling to design a roadmap for future growth.

In this article Bista Solutions will explain what are the advantages that come with Big Data and Analytics:

  • Big Data can unlock significant value by making information transparent. Leveraging big data can enable businesses of all kinds to make large volumes of information transparent and usable.

  • Organizations can generate and maintain more and more transactional data in digital form. Organizations can collect more accurate information on every minute thing ranging from inventory tracking to sick leaves and therefore expose variability and boost performance.

  • It enables companies to get accurate insights which imply better decision making and minimized risk.

  • It can be used to develop the next generation of products and services. Big Data Analytics can also be a great help to glean essential information that determines product and service improvements.

  • Big Data is secure. In a survey conducted amongst the companies leveraging big data. It was found that the secure infrastructures that are built on big data platforms will save company’s 1.6% of the annual revenues which were earlier spent on recovering the data breach issues.

  • A particular challenge arises with organizations that need to process and exploit unstructured data. This challenge is taken care of with some big data tools, specifically those that are based on Hadoop and are designed from the ground up to manage and analyze unstructured information. This would otherwise not be accomplished with some of the most conventional business intelligence (BI) and data warehousing tools as well.

Organizations that invest in big data will witness that returns on these investments will deliver over a period of time. Better business decisions mean that companies can reduce the risk of their decisions and this will lead to reduced costs and hence increases the marketing and sales effectiveness.

The success of a company not only depend on the company is performing and how it is being looked after but also depends on various other social and economic factors. The predictive analysis that is fuelled by Big Data technologies can help the organizations to scan and analyze newspaper reports or social media feeds so that you can always be up to date on the latest developments in your industry. Big Data also helps you to understand what others perceive of your products so that you can adapt them, or your marketing if need be.

Making ERP implementation a Success using Change Management

Making-ERP-implementation-a-Success-using-Change-Management
  1. Odoo development firms should have a good change management process in place to handle the entire cycle of Change Management since Change Management is very vital for Business suite Applications due to complexity & mapping of business processes in different departments & business operations
  2. Odoo development firms should define a unique way of change management process due to agility requirements for business operations and every changing business environment due to stringent competition in different business domains. Firms have to be up on sleeve for the ERP implementation with well-defined set of ERP features & change management is one part which has to be carefully drafted into ERP management & ERP Implementation
  3. ERP Implementation has a greater stakeholder impact considering its management and its application in different business domains since every stakeholder has his own department to look after and the Business suite application should satisfy the needs of the department in a straightforward manner
  4. ERP features require change management for process enforcement and to have processes define the change & control its impact to the business operations in such a way that it is crafted in a lenient manner to handle the process flow with multiple data points linked and handled precisely.
  5. Change management plays a very important role in the ERP environment with its purpose of managing the ERP features & a complete ERP management & ERP Implementation