Difference Between ETL And ELT And Their Importance
ETL is the most commonly used method while transferring data from source system to destination system or Data Warehouse. And ELT is increasingly in demand in today’s analytical atmosphere. Hence sometimes there are the cases where you might have to use ELT processes also. So what is the difference between these two? How do we use them, how is data loaded and how do we utilize the data in between these processes? We will cover the differences between ETL and ELT and their importance one by one.
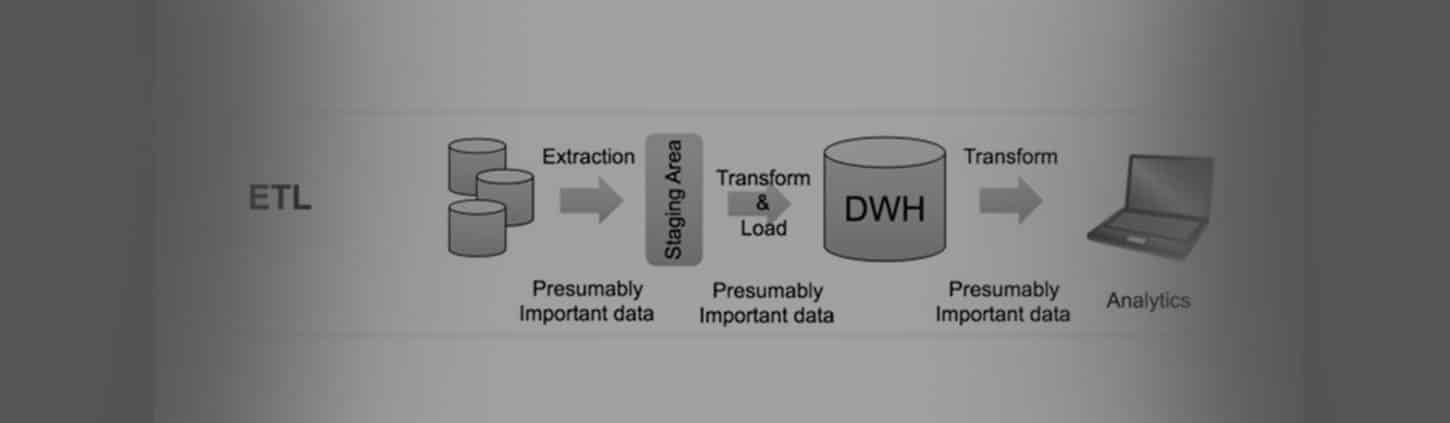
ETL (Extract, Transform and Load) :
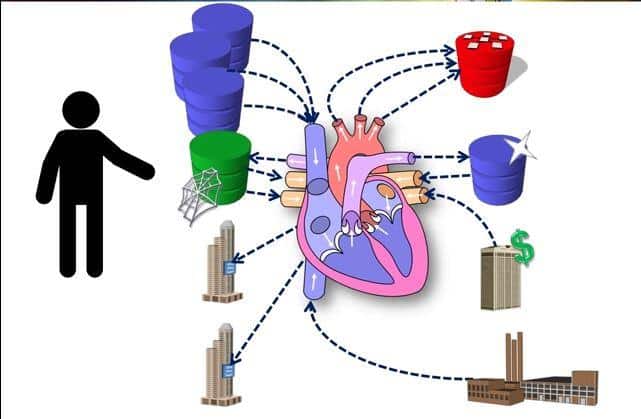
Extract, Transform and Load is the process of extracting the data from sources (which is present outside or on-premises, etc) to a staging area, then transforming or reformatting… with business manipulation performed on it in order to fit the operational needs or data analysis, and then loading into the target or destination databases or data warehouse.
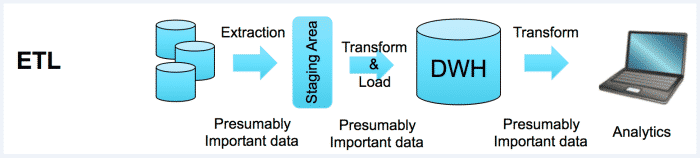
Typically, at the extraction process data from the source system is loaded into staging area i.e. staging tables for the temporary process. The extract state copies data from sources system to staging tables quickly in order to minimize the time to query to sources system. Transform step involves data manipulation or performing business calculations on the staging tables those are copied from the source system, this step will reduce the time of performing the operation on only the relevant data rather than whole source system before loading into Target Data Warehouse. Once this transformation step is performed then those needful data is loaded into target data warehouse for Business Intelligence purpose.
ETL uses pipeline approach i.e. data flow from source to the target and transformation engine or scripts takes care data manipulation or calculation between these stages.
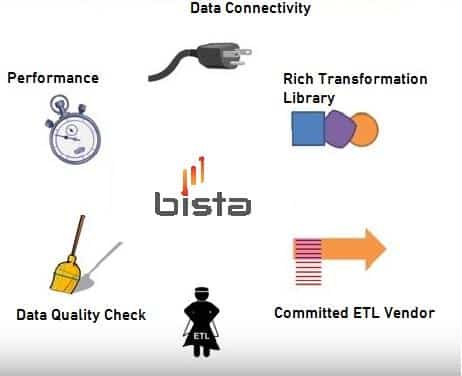
Numerous tools are present in the market to do the ETL process such as Talend Data Integration, Informatica, SSIS, etc. ETL is the most common methodology in business analytics and data warehousing projects. And these operations can be performed by custom programming or above-mentioned ETL tools which can undergo Extract, Transform and Load process.
While ETL process overall time consumption is ideally less than other processes, as ETL process involves the only extraction of needful data for the present requirement and data manipulation on that particular data rather than performing the operation over whole data. Hence typically this ETL process is used in many cases. Also, the if the Target system is not powerful then ETL is more economical.
ELT (Extract, Load and Transform) :
As the name suggests, ELT is Extract, Load and Transform is the different sight while looking at data migration or movement. ELT involves extraction of whole data from the source system and loading to the Target system instead of transformation between the extraction and loading process. Once the data is copied or loaded into the target system then transformation takes place.
In the ELT process, there is no existence of transformation engine between the extract and load process. The transformation operation is taken care by the target system, so the data is directly used for development purpose and useful business insights. Hence this approach provides better performance in the certain scenario.
The drawback or weakness with ETL process is the limitation of data and the pipeline cannot hold the large data for the operation like sorting before moving to the target system. At nowadays condition how can we examine what amount of data should we required or what amount of data should we need in near future, hence there is the restriction of data in ETL process.
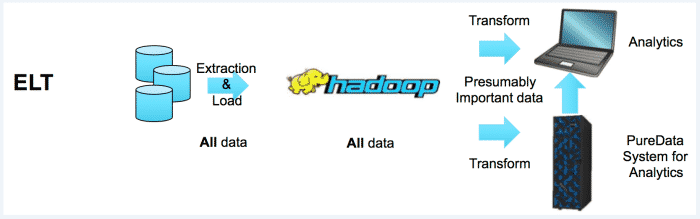
ELT processes, besides changing the position of two letters, change the overall concept of data management. Instead of restricting or limiting the data, ELT makes available all the data to be copied onto a powerful target system like Hadoop. Hadoop is capable of handling large volumes of data without being file type discriminatory. (e.g flat files, spreadsheets, tables, JSON, images, etc).
Hence the all the data from the source is extracted and loaded onto the target by collecting all the data to be needed for data manipulation, business insights, analytics for the present moment and near future as well.
ELT can overcome or tackle situations like traditional staging area based approaches in order to retrieve required amount data by performing calculations and/or manipulation techniques at target end, thus providing better performance at the business levels with Hadoop like high-end clusters and by applying analytical queries. Hadoop offers scalable data storage and processing platforms so that we can take only required data for the present moment and analyze with BI tool like IBM cogons, etc.
If you have any query for ETL please drop an email at sales@bistasolutions.com. Also, you can write us through feedback@bistasolutions.com and tell us how this blog has helped you.