Prescription for Business Insights – Pharmaceutical & Biotech Industry

With the constantly changing pharmaceutical industry environment, pharmaceutical companies need to stay competitive and sustainable. These companies encounter challenges such as developing new drugs, leading the market in the drugs they already manufacture, competing with generic drug and forwarding their own generic drug.

Pharmaceutical companies and Biotech firms also face greater Food and Drug Administration stringency and vigilance than before due to drug safety issues. This has resulted in fewer drugs being approved and increased time for drugs to reach the market. These changes in the drug market are compelling pharmaceutical companies to increase their investment in R & D and their marketing efforts. Therefore to operate cost-effectively and efficiently the Pharmaceuticals industry is shifting from traditional research and development approach to translational medicine.

Some Pharma companies are partnering or acquiring Biotech companies to reduce costs by incorporating their manufacturing and Research & development infrastructure and remove redundancies in their sales & Marketing and Admin functions. Subsequently companies are inheriting wealth of data such as R & D, clinical trials, drug development cycle, regulatory compliance, distribution, side effects, patient care, prescriptions etc.business intelligence for pharmaceutical industry

Amidst these scenarios, Pharmaceutical companies have to identify best available tools to increase revenue, reduce costs, operate more efficiently, improve marketing brand awareness and consumer loyalty along with keeping up with changing regulations and compliance. Also to stay in forefront of the competition, pharmaceutical companies are required to proactively manage their data stored in multiple data sources and the ability to analyze this information to make smart business decisions. That’s where Business Intelligence can help Pharmaceutical and Biotech firms giving richer insights to their business, reducing time to market, manage and predict drug development, regulatory and improve marketing and sales efforts.

Business intelligence tools can help evaluating drug safety information. With the help of visualization which is a key part of business intelligence software, one can prove the relationships between patient demographics and adverse effects.  The industry has realized that there is a need for technologies that could assist in mining, analyzing and translating archipelago of information from the Human genome project into particular therapies drug targets. The R & D productivity crisis that comprise of drug development pipelines needs that the industry predicts and validates the clinical properties of a drug earlier in their product life cycle. Business intelligence can help analyze the heteronomous data available with pharmaceutical companies and link scientific patterns with clinical outcomes for patients. It can also identify cost effective and viable drugs, tack thousands of clinical trials running simultaneously and globally, align field sales force and marketing for effective efforts and output.

Bista has wealth of experience working with Business Intelligence tools in numerous scenarios faced in Pharmaceutical and Biotech industry. Our experts and consultants can bring wider insights into your business exploring the opportunity with Business Intelligence. We are partners with Tableau, Jaspersoft, Talend, SpagoBI and Pentaho, with BI capabilities allowing us to recommend technology best suited to your requirements and business. Bista Solutions provides BI tools and all related services such as BI and DW consulting, architecture, designing reporting dashboards, data warehousing, Talend (ETL), R analytics, Mondrains OLAP analysis and support. We can be your solution partners and provide support in areas such as marketing and sales, research and development, supply chain, drug safety and drug development, production, legal & regulatory reporting and financial accounting.

If you are looking for Business Intelligence Solutions, kindly contact on Email Id: sales@bistasolutions.com

Contact: USA: +1 (858) 401 2332 / Other Regions +91 897 609 8988
Big data for Small and Medium Enterprises (SMEs)

For small businesses the question is “We know big data is out there, but how relevant it is for us and how do we use it?” The answer lies in your transactional, departmental and operational data. Are you able to exploit it in a way it can give you competitive advantage over competition? If you are able to answer these questions then you are ready to use Big Data.

big-data-small-medium-enterprise

What if as a small retailer, you could analyze the relationship between social media stream and buying behavior trend to come up with sales opportunities?

What if you were able to analyze your site’s visitor and track how do they move from one page to another to understand what engages them,  things they don’t like and identify cross-selling opportunities?

Here are the typical characteristics of big data solution a small enterprise should seek

Choice and Flexibility – A big data solution should allow small enterprises to select only those capabilities that meets their need and should leverage on existing system. Manageability – It should be easy to deploy and manage. The big data solution should be simple and require minimal staff training. It should have self-service capabilities so the analysts and business users can use it without any IT intervention

Cost – Enterprises should be able to pay for features they use. It should be flexible enough to start small and then scale-up as the requirement for analysis increases

SMEs that use their data intelligently tend to perform better than their competitors. It can help them improving pricing and just in time supplies. Find cheaper suppliers closer to their location and bring more transparency in pricing. Big data allows SMEs to benefit from a 360-degree view of their customer.

So if you own, let’s say a cake shop, you know that if your vendors are providing you inventory that’s fresh and flavorful. Big data can help you plan better and work wiser – make your business even sweeter.

If you want a free consultation on using your data to enhance your business, give us a call at +1 (858) 401 2332

3 Best Practices to follow during BI Implementation

Introduction

BI software can readily access a company’s information to help companies make effective business decisions and meet their objectives. Nevertheless, as with any technology the implementation, roll out and usage practices play a critical role in the success of BI.

: business intelligence software

Let us understand the few Best Practices of Business Intelligence Software Implementation

Business Alignment: “Without business in business intelligence, BI is dead”- Gartner.
As Gartner suggests, only 30% of business intelligence projects are able to meet the objectives of the business. Therefore, unless there is a buy-in on the BI initiative throughout the enterprise, it would not be able to generate the desired results expected out of the program. The success of any BI implementation lies in collaboration between IT and Business with the merger of technology and business goals

Agile and modular approach: An effective implementation can be achieved with agile development and emphasize on breaking all elements of the project into small chunks. Bring cooperation and focus on specific areas guided by overall strategy

Governance and Project Management: Very important and imperative to have governance structure for BI implementation since it can touch every area of an organization. BI initiatives requires collaboration and ownership from the business and IT, data management standards, robust project management and continuous process improvement

Conclusion – A Business Intelligence Software implementation can take lot of effort and money unless planned and executed well with experience. Bista Solutions has worked on medium to large scale BI deployments with success.

Do reach out to us if you are looking for a BI partner, we would be more than glad to bring our experience.

Bista Solutions Inc. Wins “Best Partners Americas 2015” Award At Odoo Award Ceremony In Odoo Experience


Bista Solutions, BEST ODOO PARTNER OF AMERICA

June, 5th 2015 – Atlanta, USA: Enterprise Software Company Bista Solutions, Inc. proudly announces its achievement of winning Odoo’s “Best Partner Americas 2015” award during the Award Ceremony at Odoo Experience in Louvain-la-Neuve, Belgium on June 4, 2015.

This award program honors partners who have best embodied Odoo values and spread the Odoo concept globally.

Odoo Gold Partner America

“We are glad to announce this huge achievement! Winning the ‘Best Partners Americas 2015’ award is a matter of pride for Bista Solutions. The success of reaching this milestone is possible only because of our team’s hard work, expertise, and strong relationships with our customers,”

About Bista Solutions

Bista Solutions is the only HIPAA Compliant and ISO 9001: 2008 certified Odoo Gold Partner, with 400+ software professionals and a history of the highest number of Odoo implementations across the globe. Bista has helped many companies successfully migrate from various legacy systems to open source Odoo. Their successful project implementations enable companies to execute operations smoothly by integrating Odoo with multiple applications according to customers’ unique business needs.

About Odoo

Odoo is the world’s most customizable, reliable, and advanced open source ERP Solution offering more than 3000 business modules ranging from CRM to SRM. It comes with advanced architecture that makes it the best fit for small as well as large organizations. OpenERP now known as Odoo is specially designed to serve various industry verticals including Manufacturing, Telecom, Trading/Distribution, Professional Services, Retail, Education, and many others.

Top 5 trends in BI-Analytics

Ease of use: In past advanced analytics required command line code. Today with emerging automation techniques the analytics vendors have made interfaces easier to use with advanced visualization capabilities. Blending and preparing the data has become easier. These techniques enable the software to suggest models using the variables and examining the data. The ease of use is enabling organizations to succeed early and become more data driven. With ease of use organizations are socializing BI and Analytics to enable non-IT, business users to engage and do more with their data with help of self-service BI. Embedding analytics into business processes organizations are equipping their business users with powerful analysis and faster decision making.

bi-analytics

Big Data: Big data is not only driving the usage of existing technologies but also the development of new techniques for data analysis. With increasing implementation of new infrastructure such as Hadoop and multi-platform data warehouse environments that manage, process and analyze new forms of data, structured, unstructured and real-time data, big data is playing an important role in analytics needs of organizations. Leveraging on big data processing tools allows analysts to analyze and perform queries on large data sets at real time with robust models and insightful reports.

Open Source Adoption:  Open source is rapidly gaining popularity in infrastructure and analytics space. Hadoop has become the choice of many organizations as the backbone infrastructure for their analytics need. There are many commercial flavors of hadoop that is getting more powerful day by day. With rapidly growing popularity of R language in analytics front, it has provided the impetus to the open source community. Many of the analytics software vendors are already integrating support for R in their solutions. Python is another example of open source programming language that has gained popularity in analytics space. Open source adoption is important as it provides continuous innovation in analytics ecosystem.

BI-Analytics on Cloud: More and more vendors are now offering their BI-Analytics solutions on cloud as it provides more benefits compared to conventional BI-Analytics implementations.  Organizations are moving towards cloud as it offsets cost with no capital expenditure, maintenance and even manpower. Cloud has made BI implementations cost effective and easy to deploy.

Mobile BI-Analytics: With increasing usage of mobile devices new platforms are at disposal to access data and consume analytics. Sales and service personnel can now improve customer engagements with the help of visualizations with relevant data provided on their mobile devices. Top management on the go now analyze their business performance, key metrics and deep dive into granular data to get more insights.

If you’re interested in implementing BI solutions for your business, give us a call at +1 (858) 401 2332.

Features of Tableau 9

Introduction

The new Tableau 9 is packed with game-changing enhancements that take the experience of data analysis to a whole new level. New features like parallel processing are set to deliver massive performance improvements, while the new level of detail calculations will make once complicated table calculations child’s play. So here are the few important new features in Tableau 9.0

  1. New options in Map

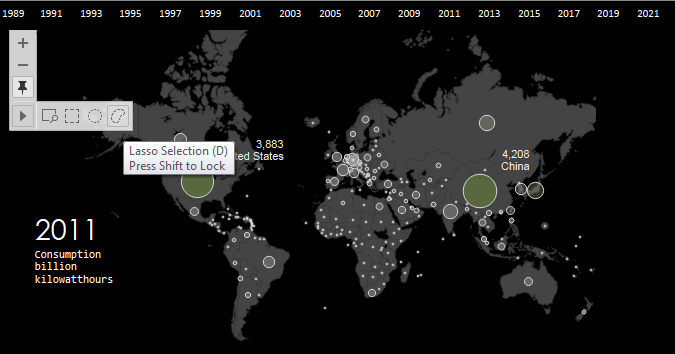
The “Tableau Classic” map has been removed from the Map Options. Hover over the map and the map toolbar is shown, the first button is a search tool allows you to search for geographic locations around the globe. Lasso tools have been improved in maps. There is now a circular and freeform polygon tool to select marks on a map.

tableaue-new-map-option

2. Direct connector for SAS, SPSS, R – stats package files

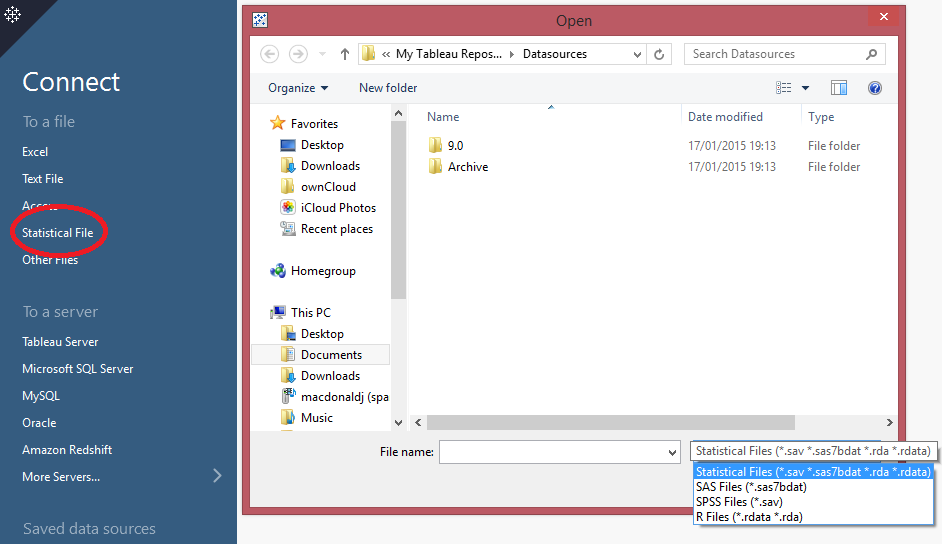
Stats files can now be visualized by Tableau. This new connector brings native support for a number of statistical package files including:

.sas7bdat – the file format used by SAS

.sav – the binary file format used by SPSS

.rdata, .rda – the file formats employed by the R statistical analysis package

Tableaue-Direct-connector-for-SAS

3. Ad-hoc Calculation

The speed of design is faster too along with speed of platform. Now: switch to the Analytics Tab and you have drag and drop analytics! For quick calculations double click a blank space in Rows, Columns, or Marks and type some code to create an Ad-hoc calculation.

Tableaue-Ad-hoc-calculation

4. Updated colour window with hex values and colour picker

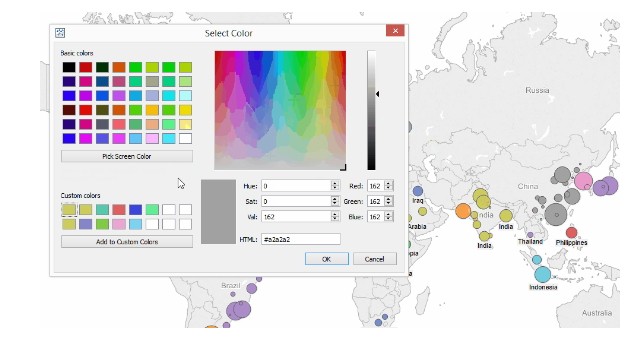
The new and improved colour palette dialogue box now allows you to specify and see hex values for all the colours you’re using – very handy for putting together those custom colour palettes, and what’s more you can now also pick a colour from anywhere on your desktop and drop it into the palette.

Tableaue-color-window

5.  Arrow to the right of the new calculation window

The new calculation window auto-completes your typing with suggested dimensions, measures and formulas. Click on the arrow to the right you get your formula drop-down, complete with explanations and a usage example. It’s a nice way to keep the interface clean while still giving you the option to search the formula list. While we’re on the subject, don’t forget to check out some of the new calculations introduced in v9, like the RANDOM(), HEXBIN, and REGEXP functions.

tableaue-new-calculation

6. The new “Split” function

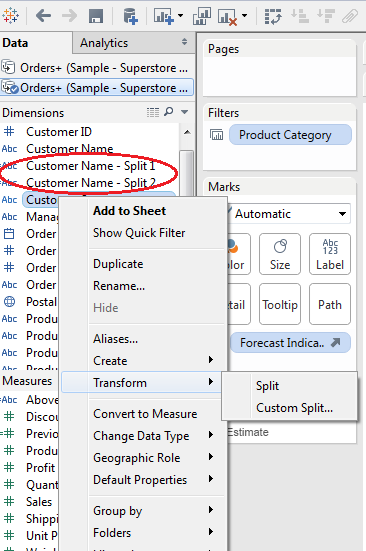
With this new feature you can convert text to columns in Tableau on a go. What typically used to be a job for Excel, SQL, or a calculated field of LEFTs and RIGHTs has now been made a one-click operation in Tableau. Just right-click on the dimension you want to split, navigate to the new ‘Transform’ menu and click Split. Tableau will automatically try to figure out the delimiter and split the data accordingly, but you can also choose Custom Split and specify the delimiter yourself if you like.

Tableaue-split-function

7. The new “Tableau Discover” side menu on the start page

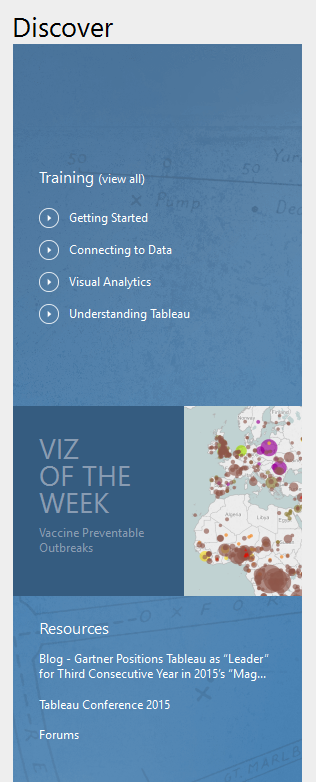
When you open Tableau v9 for the first time you’ll now notice a new menu on the right that alerts you to a bunch of handy Tableau resources, including links to training for beginners, a highlight section on the Tableau Viz of the Week.

Tableaue-discover

8. “Tableau” button in the top left

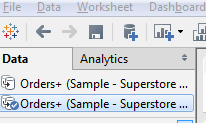
Tableau now includes a handy “Tableau” button in the top left of the menu bar, which allows you to quickly flip between your viz and the Tableau Desktop start page.

button-top-left

9. The “Add New Data Source” button drop-down menu

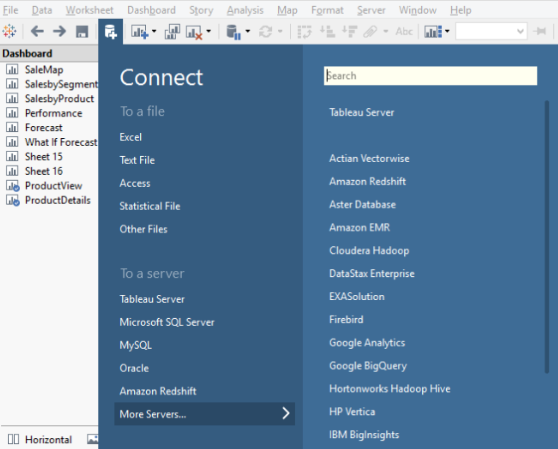
Clicking on the add new data source button in the menu bar now reveals a drop-down menu, which allows you to really quickly connect to a new data source, without having to navigate to another page

Tableaue-new-data-source

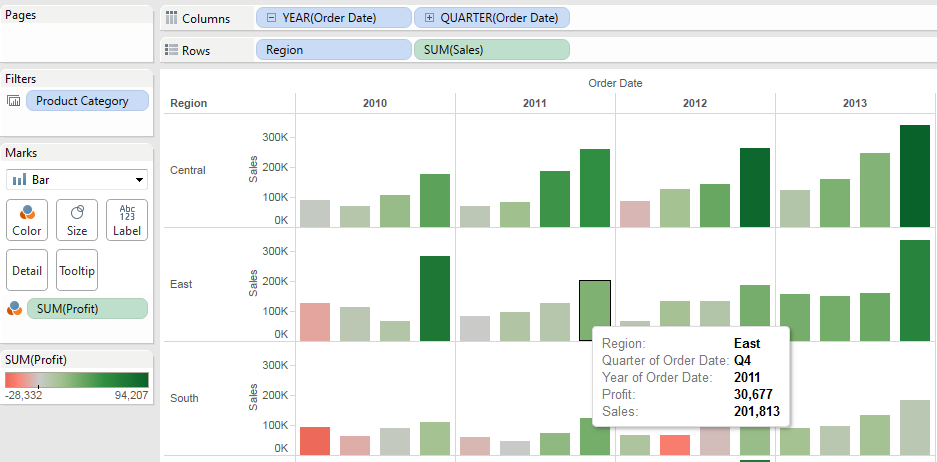
10. Tooltips stay shown until you move your mouse, rather than dropping off after a few seconds

In current versions of Tableau, a tooltip only stays alive for 8 seconds and then it disappears. Now in Tableau v9, tooltips stick around for as long as you leave your mouse in place. Furthermore, tooltips are now super responsive, populating with new data for whichever mark you’re hovering over in real-time. You can disable it as well using tooltip window

Tableaue-tool-tips

For More Information about Tableau , Speak to our Tableau expert on: +1 (858) 401 2332

Or email at sales@bistasolutions.com

How Tableau BI Can Help You to Grow Your Business

grow your business
  • by bista-admin
  • May 11, 2015
  • 0
  • Category:

Tableau enables businesses to make decisions using the data visualization features available to business users of any background and industry. It empowers businesses to keep up with the continuously evolving technology and outperform its competition through an innovative means of visualizing their data.

Tableau connects to any data source like Data Warehouse, MS Excel or any web data. Tableau provides immediate insight by transforming data into visually engaging, interactive views in dashboards. With easy to use drag-and-drop interface one can come-up with insights in few moments rather than months or years.

Speed to Market – Tableau processes and analyzes data in easy to follow and logical manner. This helps in saving development time and making decision making faster. The ability to adapt to market needs is a huge competitive advantage. Tableau helps in rapid decision making based on your data that result in competitive advantage

Ease of Use – Tableau data visualization platform simplifies the data analysis and removes unnecessary complications, focuses on what matters most – finding the real value in your data. A simple drag and drop interface in Tableau is easy to learn and eliminates IT staff dependency.

tableau-data-visulization

Tableau capabilities –

  • Big data analysis capabilities
    • Tableau has optimized direct connections for high-performance databases, cloud data source and Hadoop. It enables you to work with your data directly to create reports, dashboards and stories. With in-memory analytical engine Tableau lets you connect to live data
    • Tableau enables the users to do their own analysis with simple drag & drop, point & click feature to easily to build charts, reports, dashboards and stories
    • Tableau’s in-memory data engine is not just restricted to fit data into your machine’s RAM. Tableau’s in-memory technology make use of all the memory on your machine, down to the hard disk, so the analysis is amazingly fast at the same time

tableau-Big-data-analysis-capabilities

  • Connection to all the standard data sources
    • Tableau has provided native connectors to popular databases (list in the below picture). These native connectors have been:
      • Optimized to increase performance
      • Leverage capabilities of each of the data sources
      • Enforce and security protocols

Tableau makes it easy to add new data sets, be it an Excel workbook, a flat file or any database. Tableau automatically blends these data sets using common fields.

tableau-easy-to-add-dataset

  • R Integration
    • R functions and models can be used in Tableau by creating new calculated fields that dynamically calls the R engine and pass the result values to R. The visualization engine in Tableau utilizes the results returned back
    • A user with proficiency in R
      • Is able to do statistical analysis on their Tableau data
      • Is able to access any R package or function that has been installed in an R server which they can access
      • Is able to take advantage of all of the visualization capabilities in Tableau to further analyze and understand their data without having to manipulate their data in R (which can be cumbersome) for the same effect.

tableau-R-integration

Interested in implementing Tableau? Get in touch with us today or read for more information.

What are the Key Features of Tableau 9.0

Key Features of Tableau 9.0 

The new Tableau 9 is packed with game-changing enhancements that take the experience of data analysis to a whole new level. New features like parallel processing are set to deliver massive performance improvements, while the new level of detail calculations will make once complicated table calculations child’s play. So here are the few important new features in Tableau 9.0

1. New options in Map

The “Tableau Classic” map has been removed from the Map Options. Hover over the map and the map toolbar is shown, the first button is a search tool allows you to search for geographic locations around the globe. Lasso tools have been improved in maps. There is now a circular and freeform polygon tool to select marks on a map.

tabeulo-map-option
2. Direct connector for SAS, SPSS, R – stats package files

Stats files can now be visualized by Tableau. This new connector brings native support for a number of statistical package files including:

.sas7bdat – the file format used by SAS

.sav – the binary file format used by SPSS

.rdata, .rda – the file formats employed by the R statistical analysis package

Direct connector for SAS

3. Ad-hoc Calculation

The speed of design is faster too along with speed of platform. Now: switch to the Analytics Tab and you have drag and drop analytics! For quick calculations double click a blank space in Rows, Columns, or Marks and type some code to create an Ad-hoc calculation.

ad-hoc-calculation

4. Updated color window with hex values and color picker

The new and improved color palette dialogue box now allows you to specify and see hex values for all the colors you’re using – very handy for putting together those custom color palettes, and what’s more you can now also pick a color from anywhere on your desktop and drop it into the palette.

updated-color-window
5. Arrow to the right of the new calculation window

The new calculation window auto-completes your typing with suggested dimensions, measures and formulas. Click on the arrow to the right you get your formula drop-down, complete with explanations and a usage example. It’s a nice way to keep the interface clean while still giving you the option to search the formula list. While we’re on the subject, don’t forget to check out some of the new calculations introduced in v9, like the RANDOM(), HEXBIN, and REGEXP functions.

new-calculation-window
6. The new “Split” function

With this new feature you can convert text to columns in Tableau on a go. What typically used to be a job for Excel, SQL, or a calculated field of LEFTs and RIGHTs has now been made a one-click operation in Tableau. Just right-click on the dimension you want to split, navigate to the new ‘Transform’ menu and click Split. Tableau will automatically try to figure out the delimiter and split the data accordingly, but you can also choose Custom Split and specify the delimiter yourself if you like.

 split-function
7. The new “Tableau Discover” side menu on the start page

When you open Tableau v9 for the first time you’ll now notice a new menu on the right that alerts you to a bunch of handy Tableau resources, including links to training for beginners, a highlight section on the Tableau Viz of the Week.

tableau-discover
8. “Tableau” button in the top left

Tableau now includes a handy “Tableau” button in the top left of the menu bar, which allows you to quickly flip between your viz and the Tableau Desktop start page.tableau-BUTTON-TOPLEFT
9. The “Add New Data Source” button drop-down menu

Clicking on the add new data source button in the menu bar now reveals a drop-down menu, which allows you to really quickly connect to a new data source, without having to navigate to another page

add-new-data
10. Tool tips stay shown until you move your mouse, rather than dropping off after a few seconds

In current versions of Tableau, a tooltip only stays alive for 8 seconds and then it disappears. Now in Tableau v9, tooltips stick around for as long as you leave your mouse in place. Furthermore, tooltips are now super responsive, populating with new data for whichever mark you’re hovering over in real-time. You can disable it as well using tooltip window

final-image

Are you looking for Tableau Implementation?  Speak to our Tableau expert on:  +1 404 631 6219

Or email at sales@bistasolutions.com

Tableau as “Leader” in BI and Analytics

Tableau implementation Company
  • by bista-admin
  • May 04, 2015
  • 0
  • Category:

As more data is analysed and collected, today every company needs Data visualization to make better decisions and Tableau is comprehensive software for Rapid fire, easy to use Business analytics. Many Business professionals are depending upon Tableau as it allows user to quickly visualize, manipulate and explore the data.

Tableau Implementation Company

Gartner positioned Tableau as “Leader” in its Magic Quadrant for Business Intelligence and Analytics Platforms; this is the third time in a row that Tableau has been rated in the Leaders quadrant.

This report evaluated 24 different software vendors on 15 criteria and placed Tableau in the Leaders quadrant.

According to Gartner, “The year 2014 has been another year of challenging execution for the market share leaders in the BI and analytics market, juxtaposed against strong execution for data discovery vendors, particularly Tableau, that are satisfying customers, meeting their buying requirements and delivering greater business value.”

Gartner also says “Customers often use the product for business-user-driven reporting as a complement to more analyst-oriented data discovery tools such as Tableau. The road map includes enhancements for data access and integration as well as to the visualization capabilities.”

To access full report Click Here

Are you planning to Implement Tableau for your organisation?

You Need a Right Tableau Implementation Company

While finding a right BI Consultant, you need to consider skills and experience and at the same time you also have to match your Business goals. At Bista Solutions, we provide comprehensive Tableau services with personalized approach to you and your data.

Bista has strong expertise in Implementing Tableau BI and we are confident that we will meet all your Tableau and data requirements.

For Quick Chat with our Tableau Expert

Contact: USA – +1 (858) 401 2332 / Other Regions: +91 89760 98984 or Email : sales@bistasolutions.com

How To Manage & Forecast Your Resource Planning ERP

resource planning erp

The success of a project depends on planning, organising and managing resources.  A project begins with resource mapping and for any Project manager Resource mapping is important and challenging task. . Improper resource planning affects project delivery, control on project, leads to lack of task accountability and clarity. Research says only 34% of the projects are delivered on time and on budget with desired functionality, because of improper resource planning.

Organizations have limited resources to perform tasks. Hence it becomes important for project manager to successfully execute a project within the available resources.

Bista has developed customized module in OpenERP Odoo which helps Project Managers to track which resource is engaged on a project and monitor resource level during/end of the project.

With the help of this module you can actually simplify your Resource planning as you easily track the number of resources available and resources that are busy and the resource that are on leave.

track-resource-erp

The different bar indicates different constraints.

 Blue – Busy Time

Green – Free Time

Red – Leave

Yellow – Entire Duration

Understanding more about resource mapping sheet

Start with the selection of the duration. The working mechanism depends upon calendar defined and working hours, number of working days in a week is also picked form calendar. Whenever any holiday or non-working day encountered during task duration, system automatically shift that day to next working day.

track-resource-erp-bar

The result will be shown corresponding to the selected duration only.

 Hovering over the bars will show the details such as project name in which the resource is busy, the duration in figures and the start date.

 Extremely useful for project planning activities and to identify and schedule the resources needed to delivery of project successfully.

 track-resource-erp-graph

When resource allocation becomes a challenge, this customization of Odoo will help you to overcome them. If you are looking for similar module, kindly contact on

Email Id: sales@bistasolutions.com

Contact: USA:  +1 (858) 401 2332 / Other Regions +91 89760 98984
Also see our reporting dashboards for project management.